Backtest Results — The Numbers
Real backtest results, straight from the NinjaTrader Strategy Analyzer — the configs I trade and tune, with net profit shown right next to
max drawdown so you see the whole picture. Every figure below is at 1 micro contract,
the smallest sizable unit, so the drawdown stays honest and the numbers map straight to a prop-firm eval.
How to read these two columns. Every strategy is tuned for a current ~3-month window — that's the config I
trade, shown in the Current tune column. The 15-month column runs that same setup all
the way back as a stress test — be straight with yourself about it: the long window is not what the strategy is optimized
for. The 3-month tune is the live edge; the 15-month view just shows you it isn't fragile and stayed positive across very different markets.
Want the full picture? These are snapshots. The
Prop Firm Analyzer — included free with Elite, or $39.99 standalone — runs this same data on your machine:
slide the date range anywhere from 3 to 15 months, combine strategies, change contract size and prop-firm targets, and watch the equity
curve and drawdown move. Same data, yours to drive.
Standard
Standard Strategies
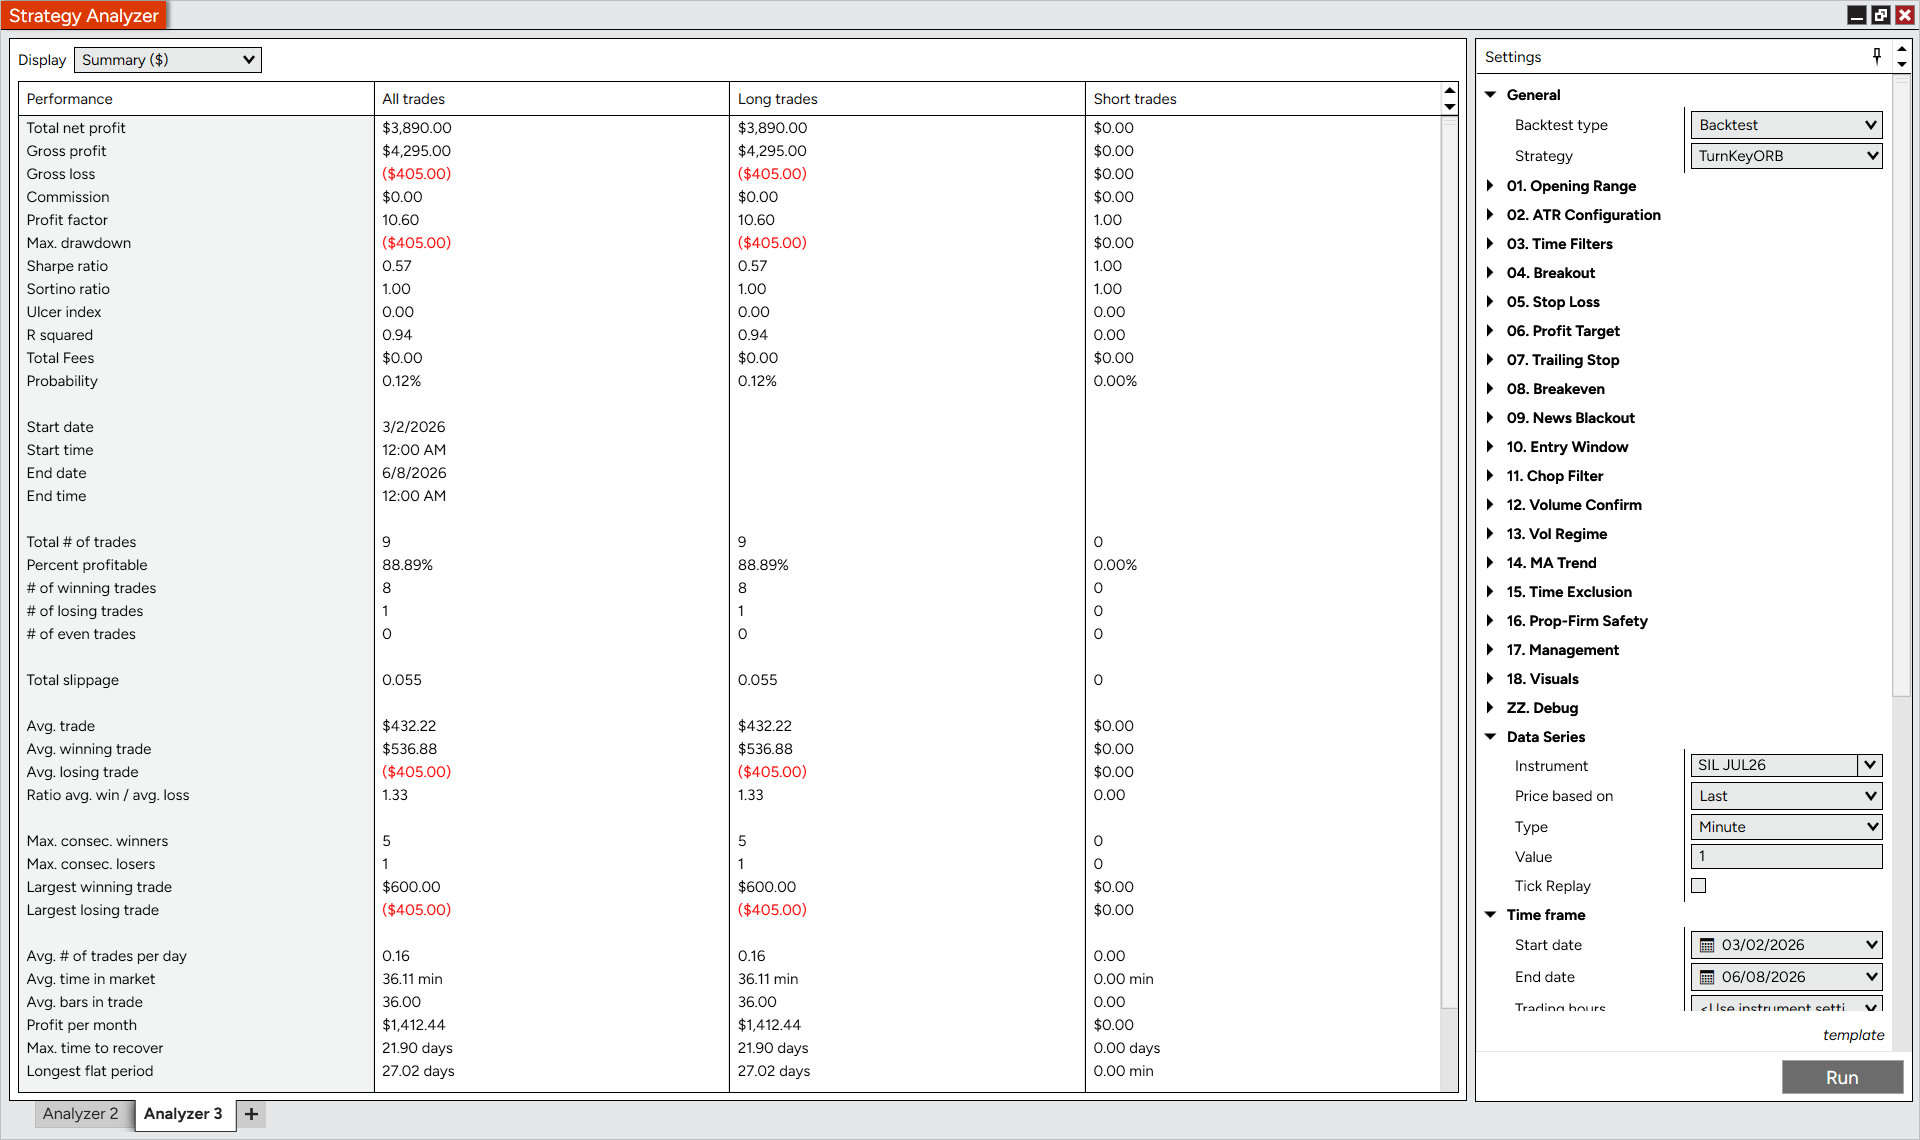
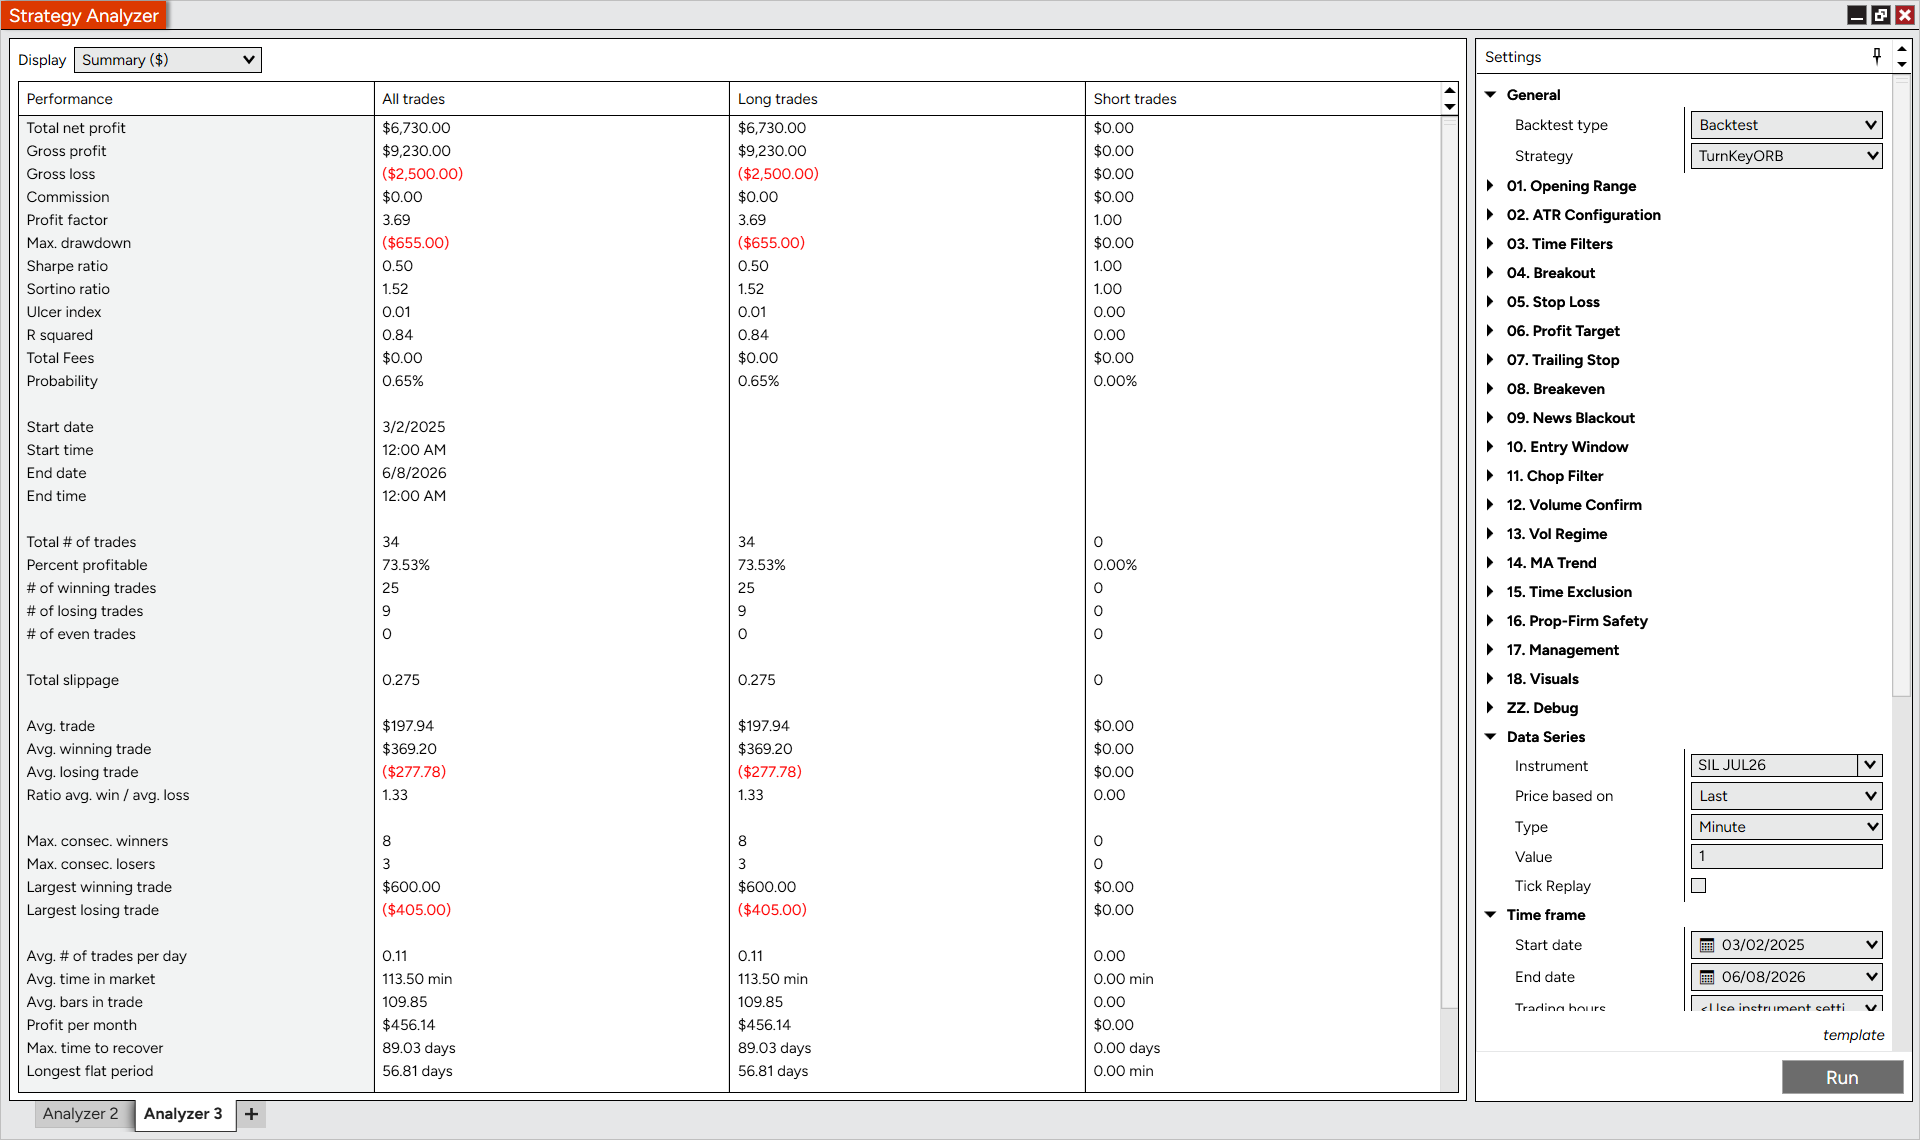
TurnKeyORB — SIL
1 micro contract · 1-minute
| Metric | Current tunelast 3 months | 15-monthstress test |
|---|
| Net P&L | $3,890 | $6,730 |
| Win rate | 88.9% | 73.5% |
| Profit factor | 10.60 | 3.69 |
| Max drawdown | $405 | $655 |
| Avg / month | $1,412 | $456 |
| Trades | 9 | 34 |
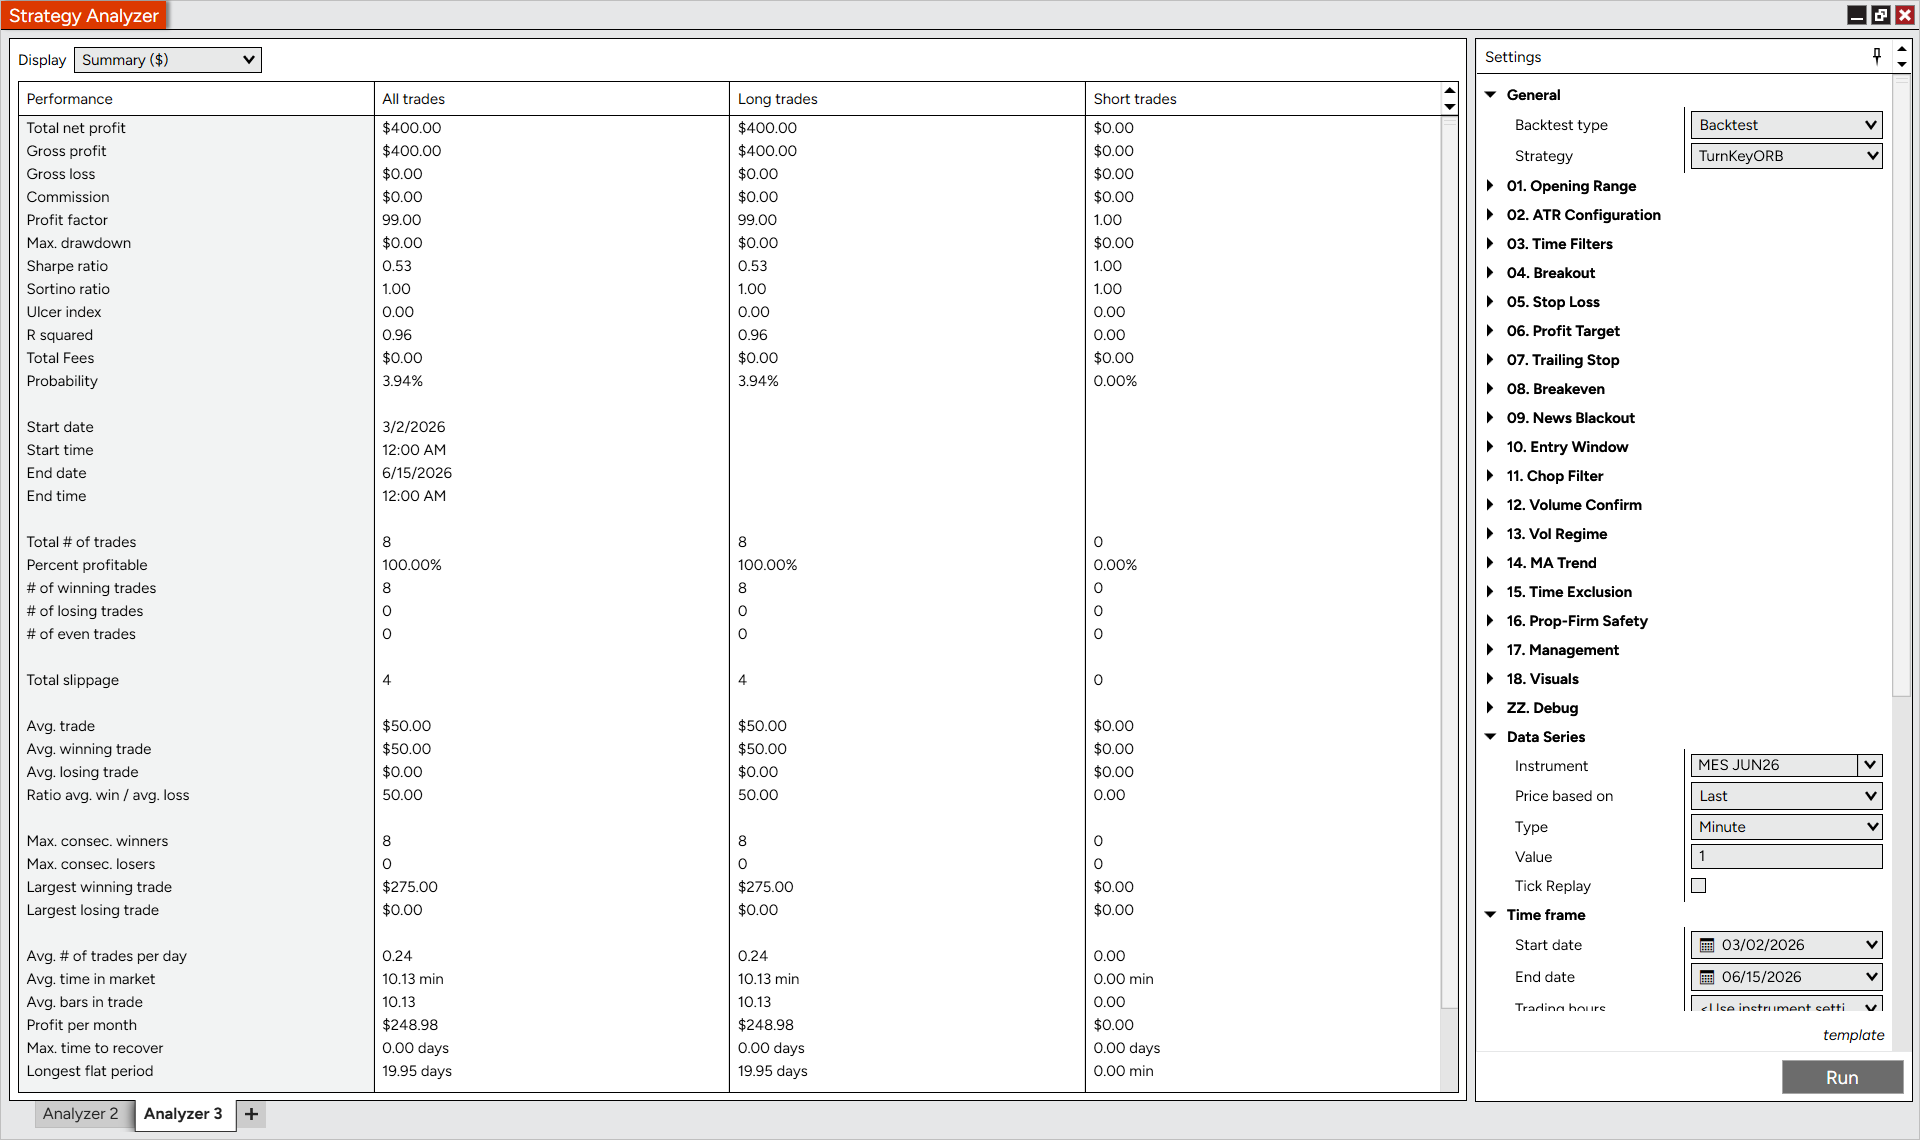
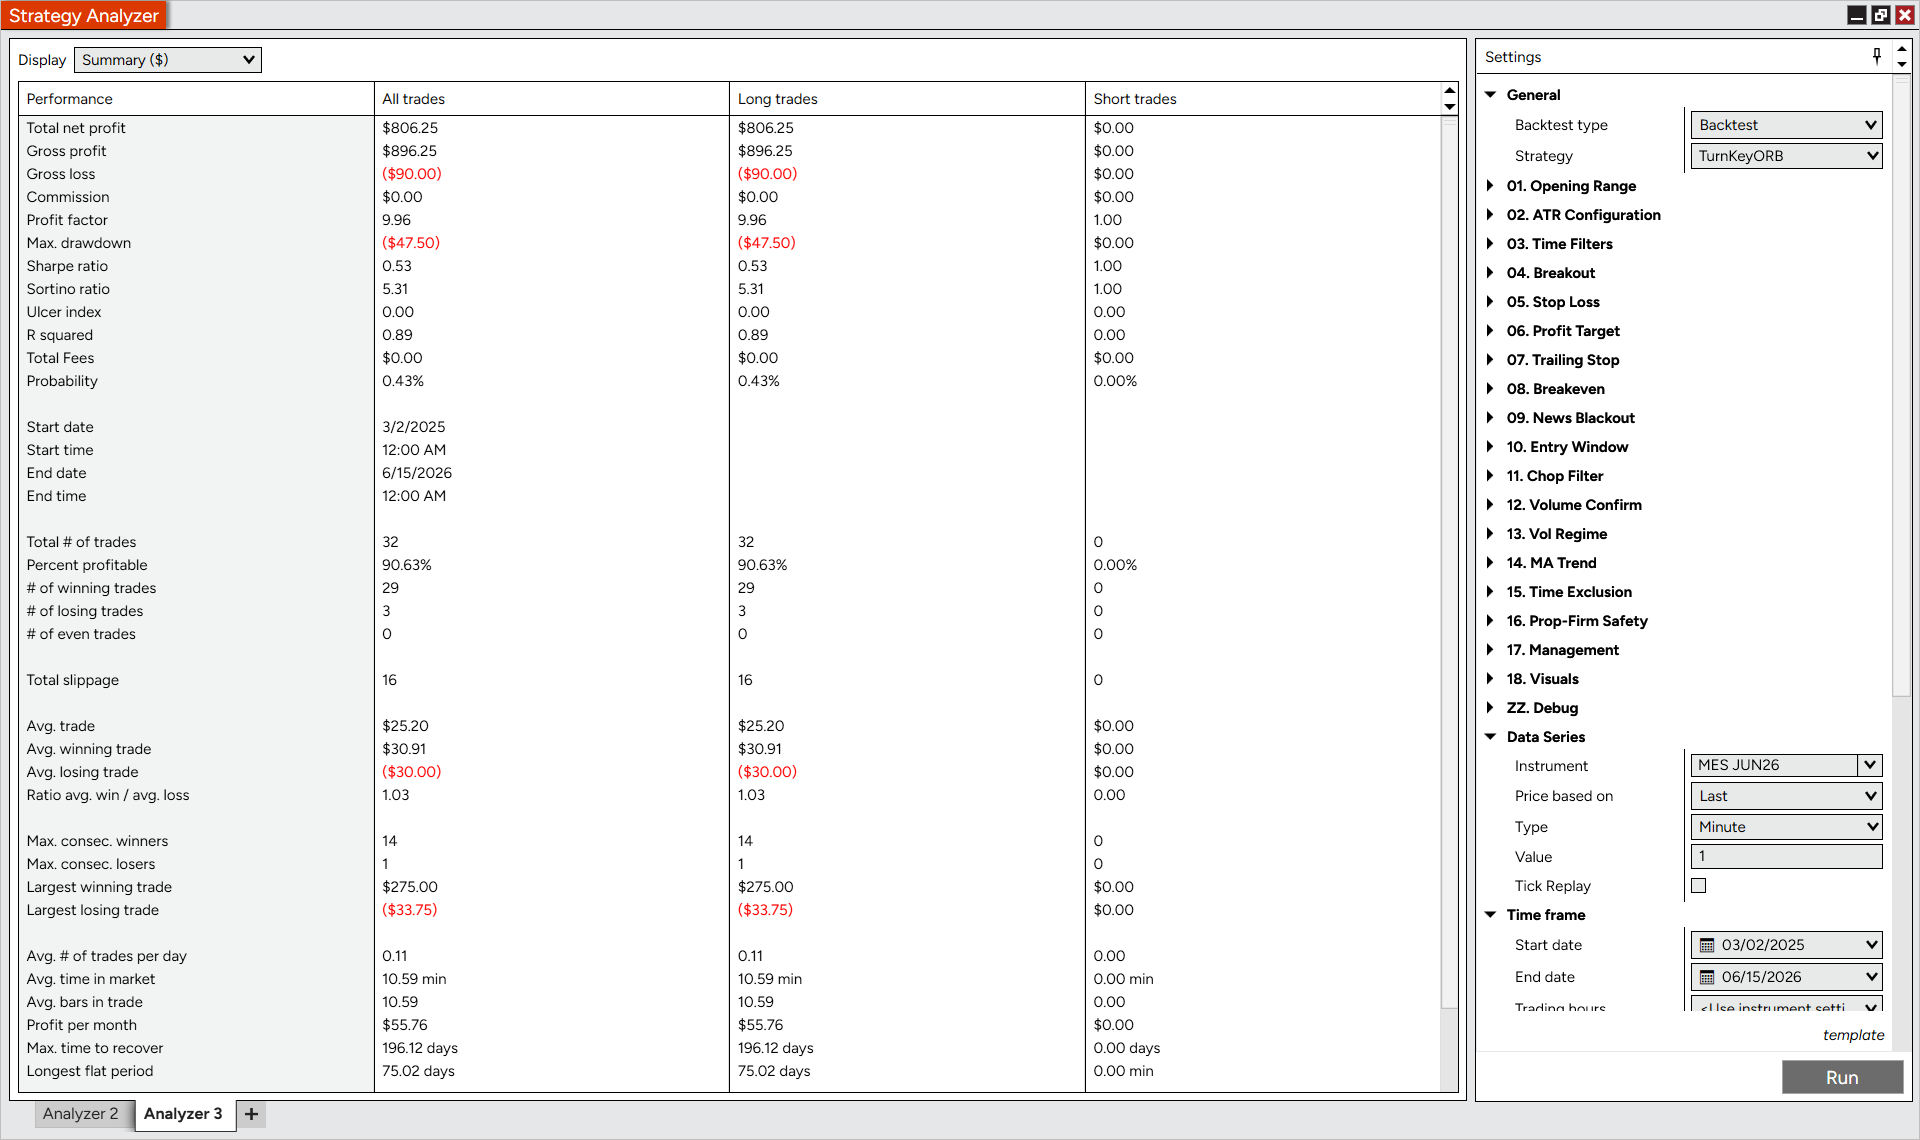
TurnKeyORB — MES
1 micro contract · 1-minute
| Metric | Current tunelast 3 months | 15-monthstress test |
|---|
| Net P&L | $400 | $806 |
| Win rate | 100% | 90.6% |
| Profit factor | no losses* | 9.96 |
| Max drawdown | $0 | $48 |
| Avg / month | $249 | $56 |
| Trades | 8 | 32 |
* Small 3-month sample: 8 trades with no losers in the window, which is why that column looks flawless. The 15-month column (32 trades) is the more representative read.
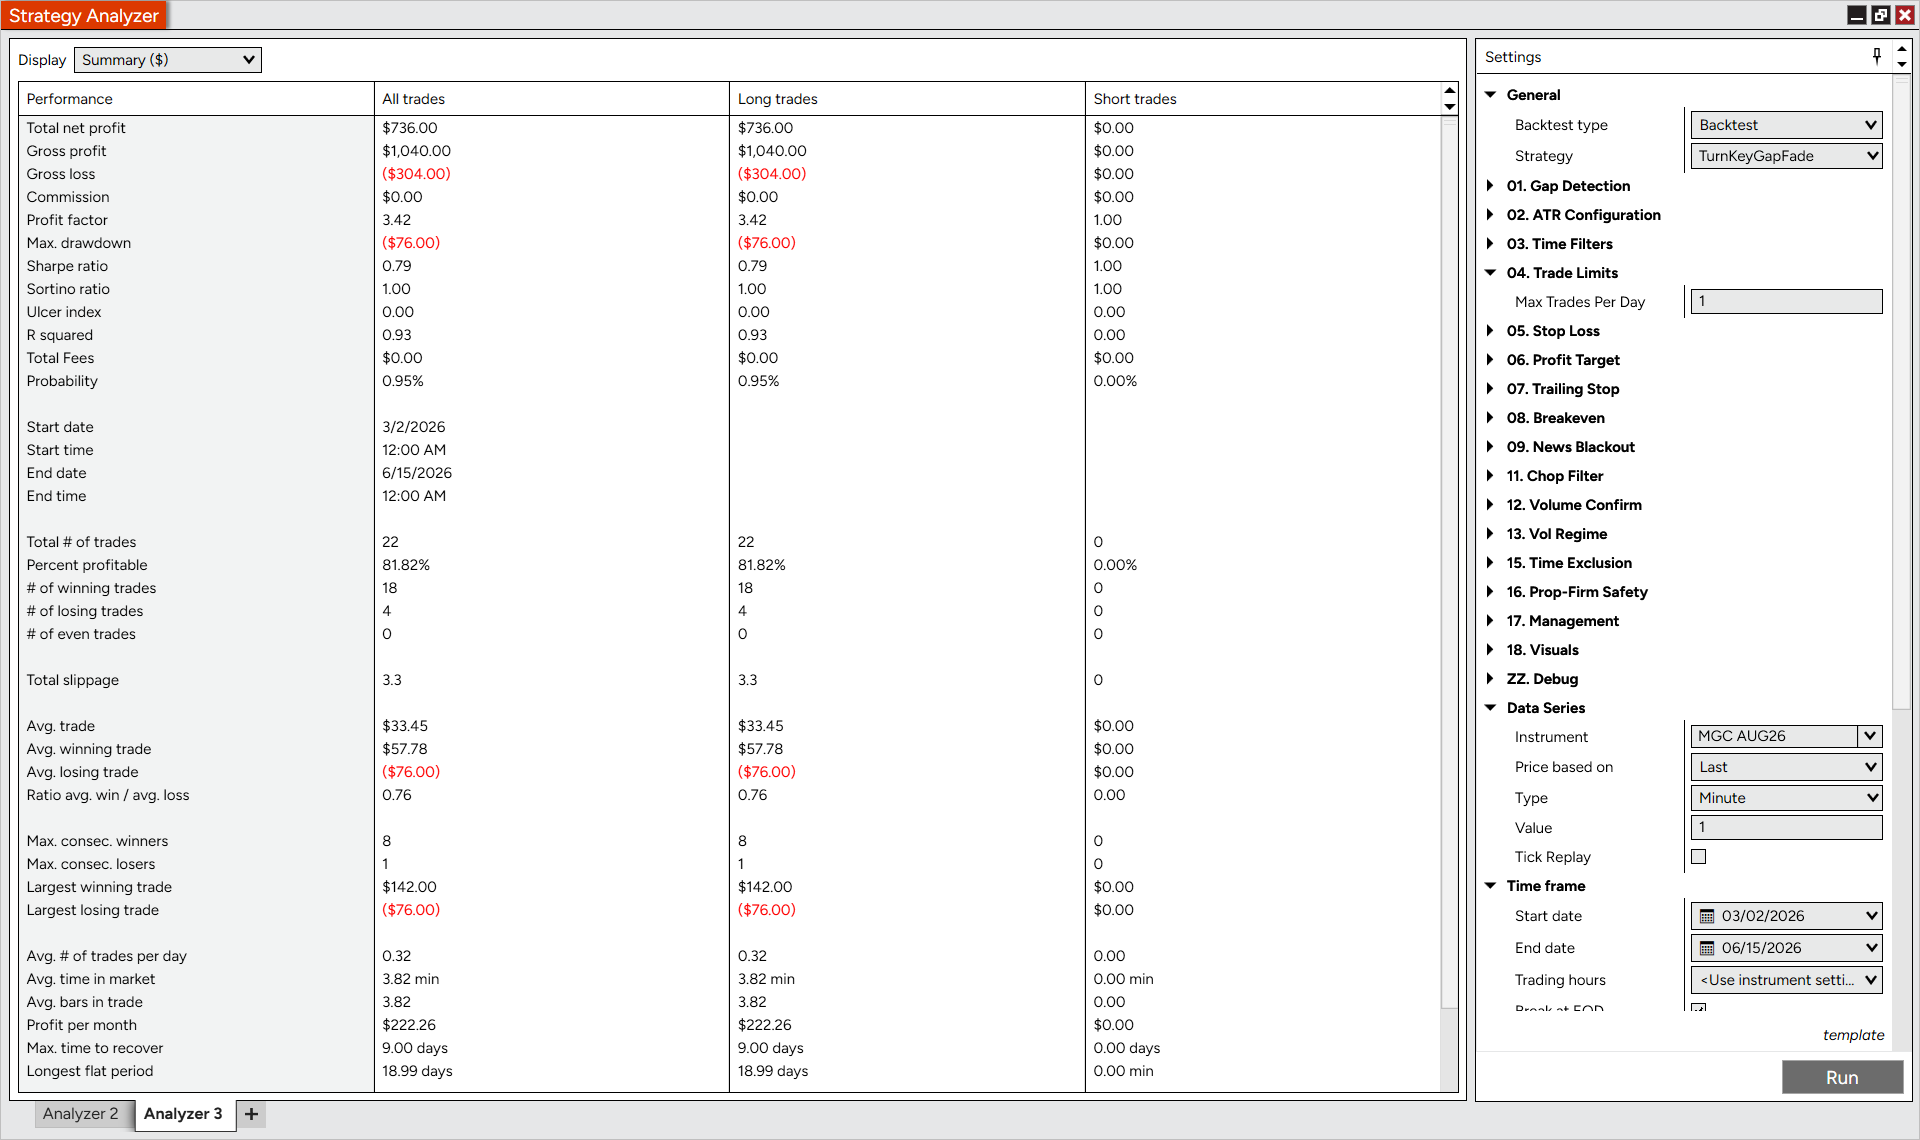
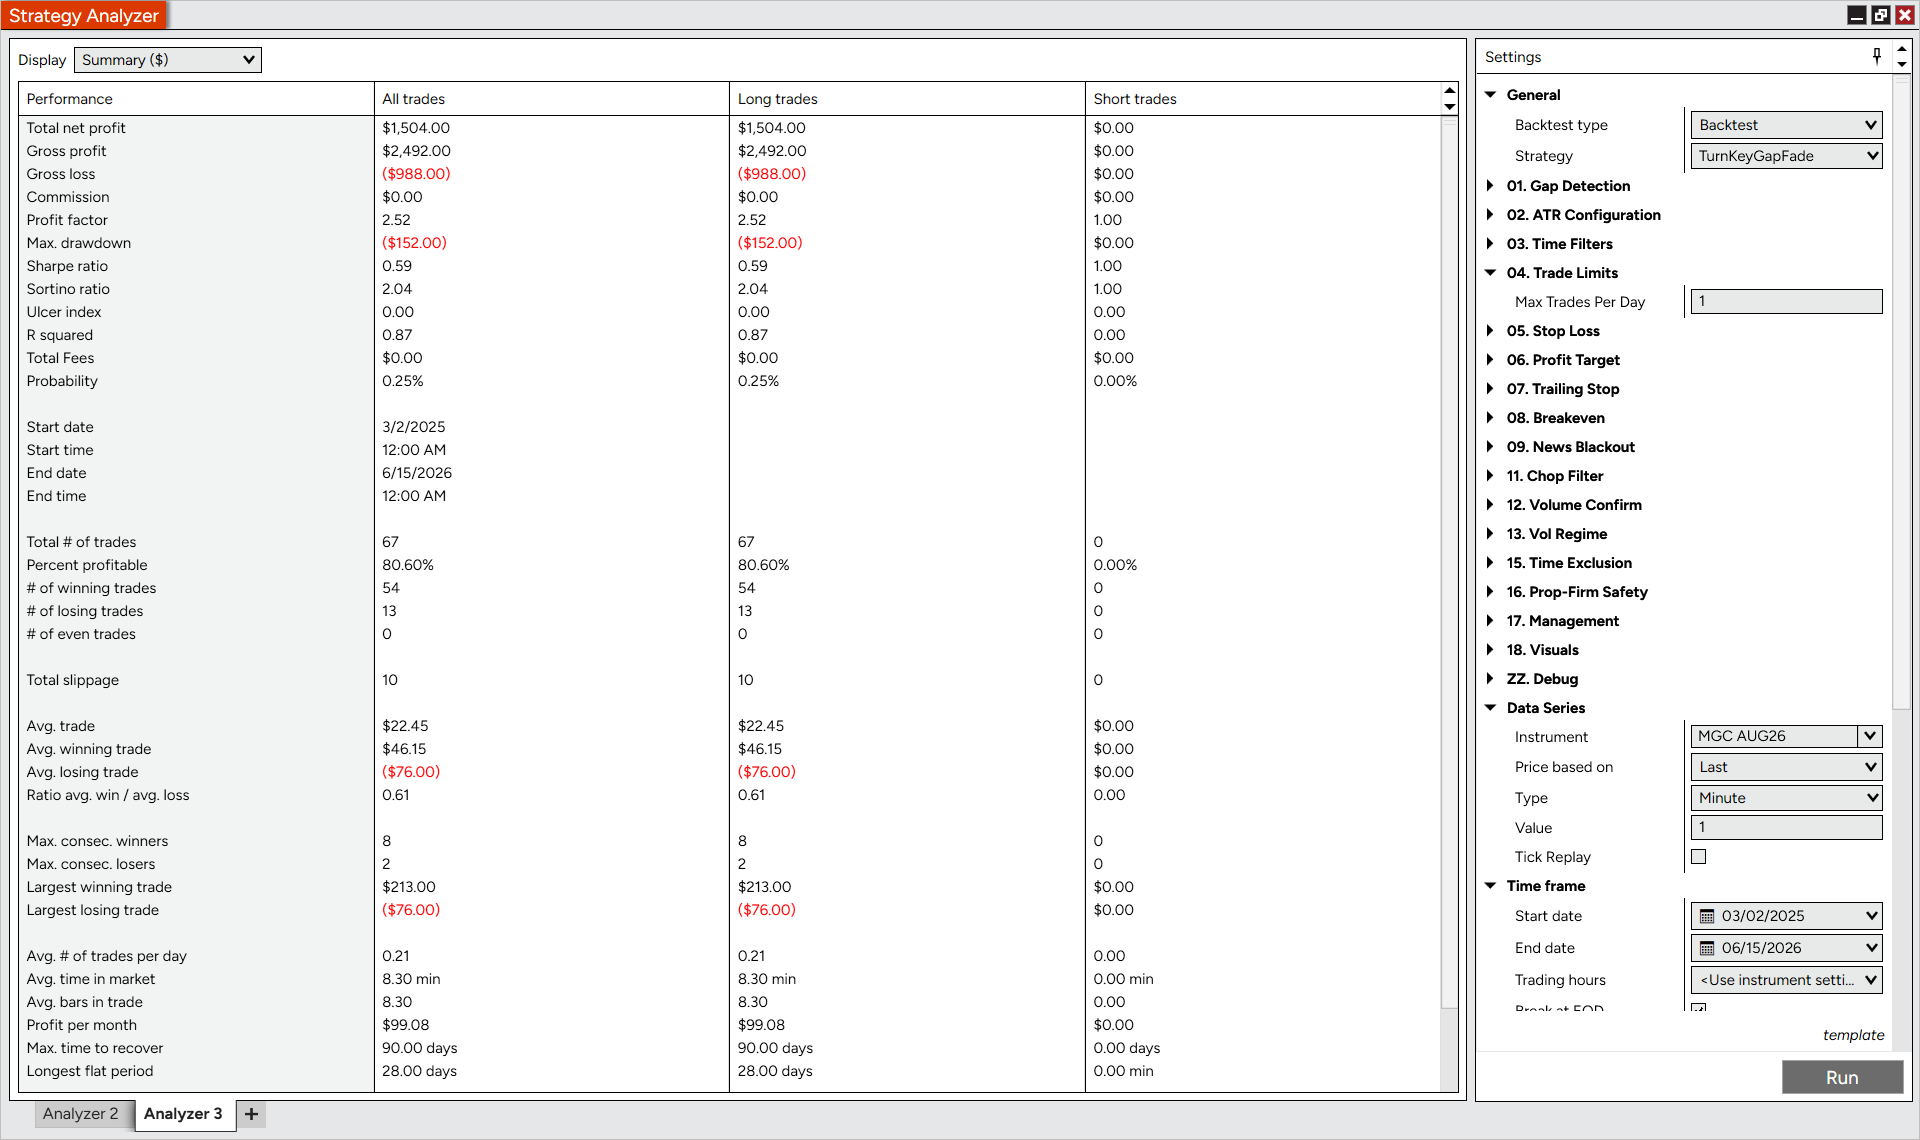
TurnKeyGapFade — MGC
1 micro contract · 1-minute
| Metric | Current tunelast 3 months | 15-monthstress test |
|---|
| Net P&L | $736 | $1,504 |
| Win rate | 81.8% | 80.6% |
| Profit factor | 3.42 | 2.52 |
| Max drawdown | $76 | $152 |
| Avg / month | $222 | $99 |
| Trades | 22 | 67 |
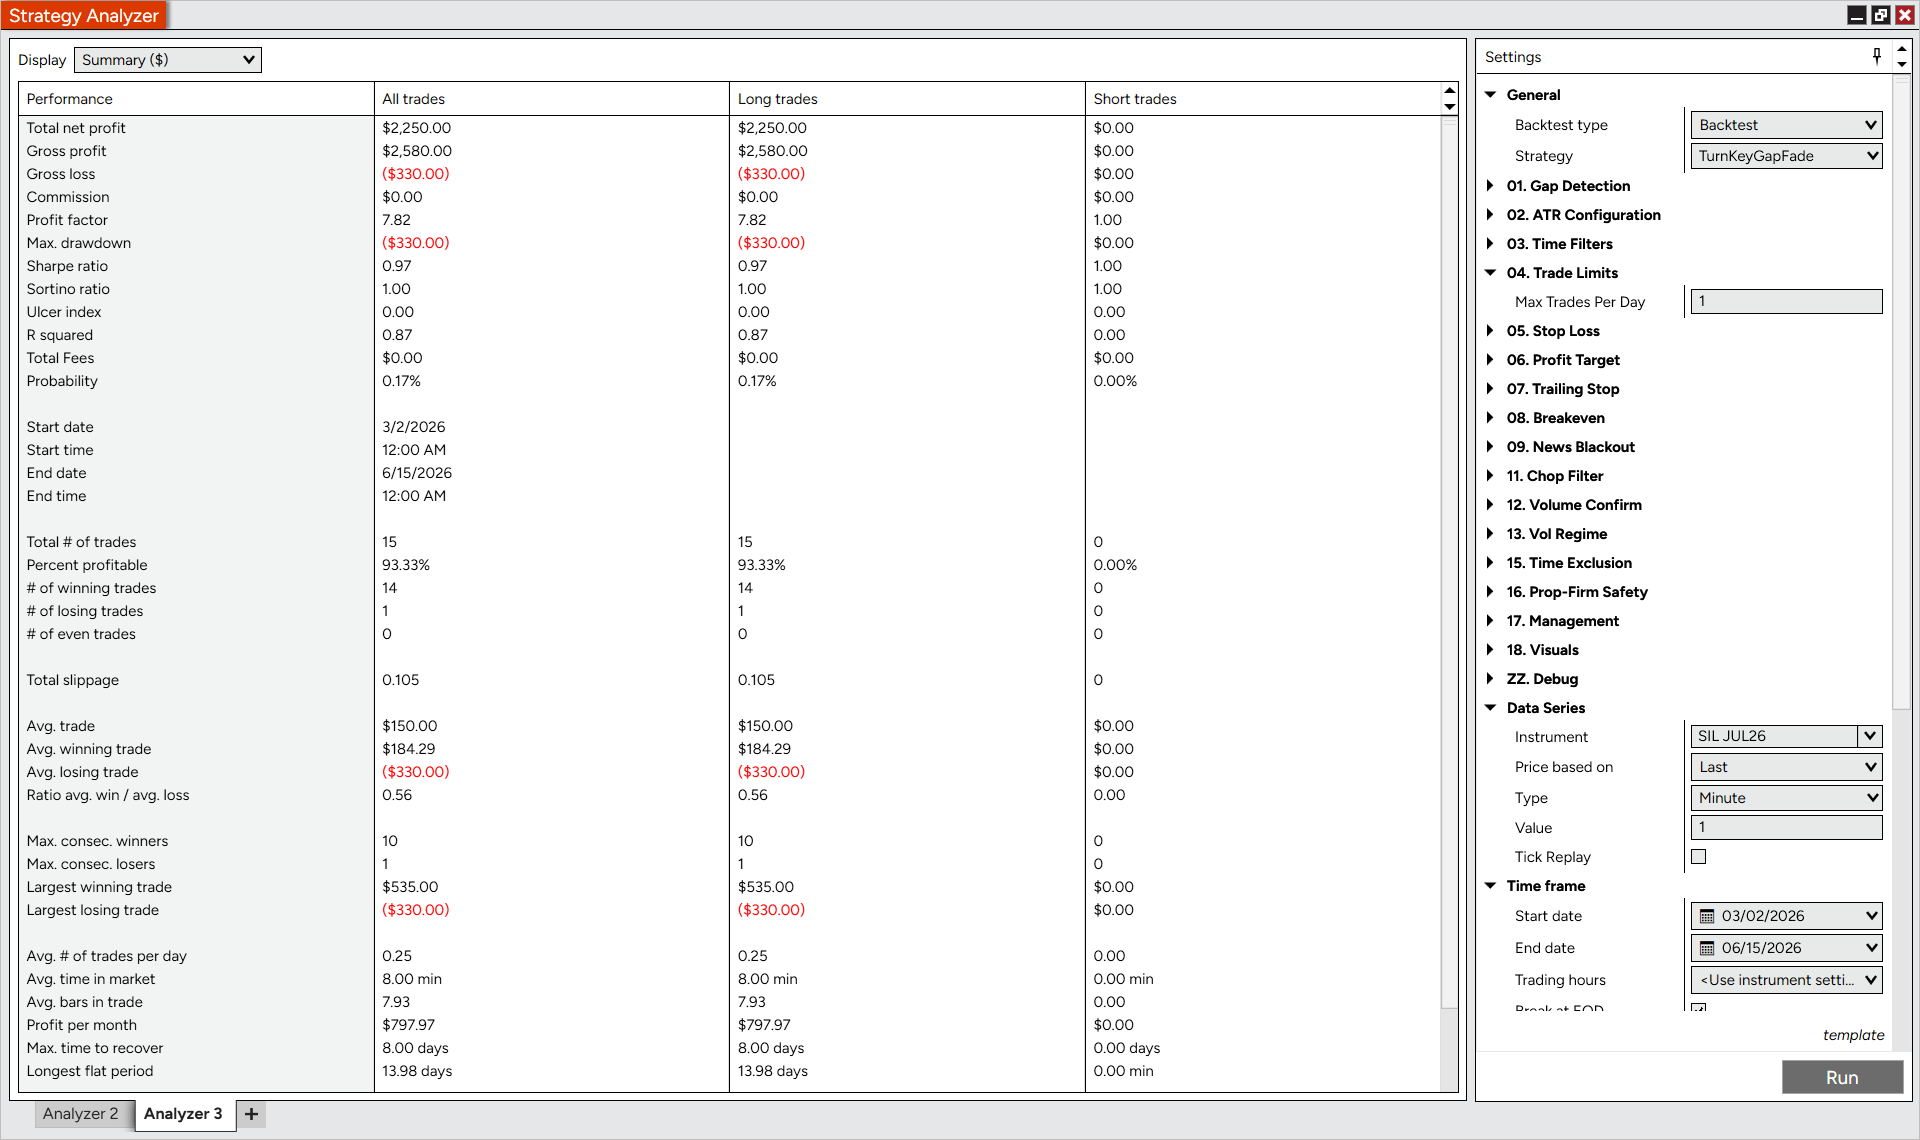
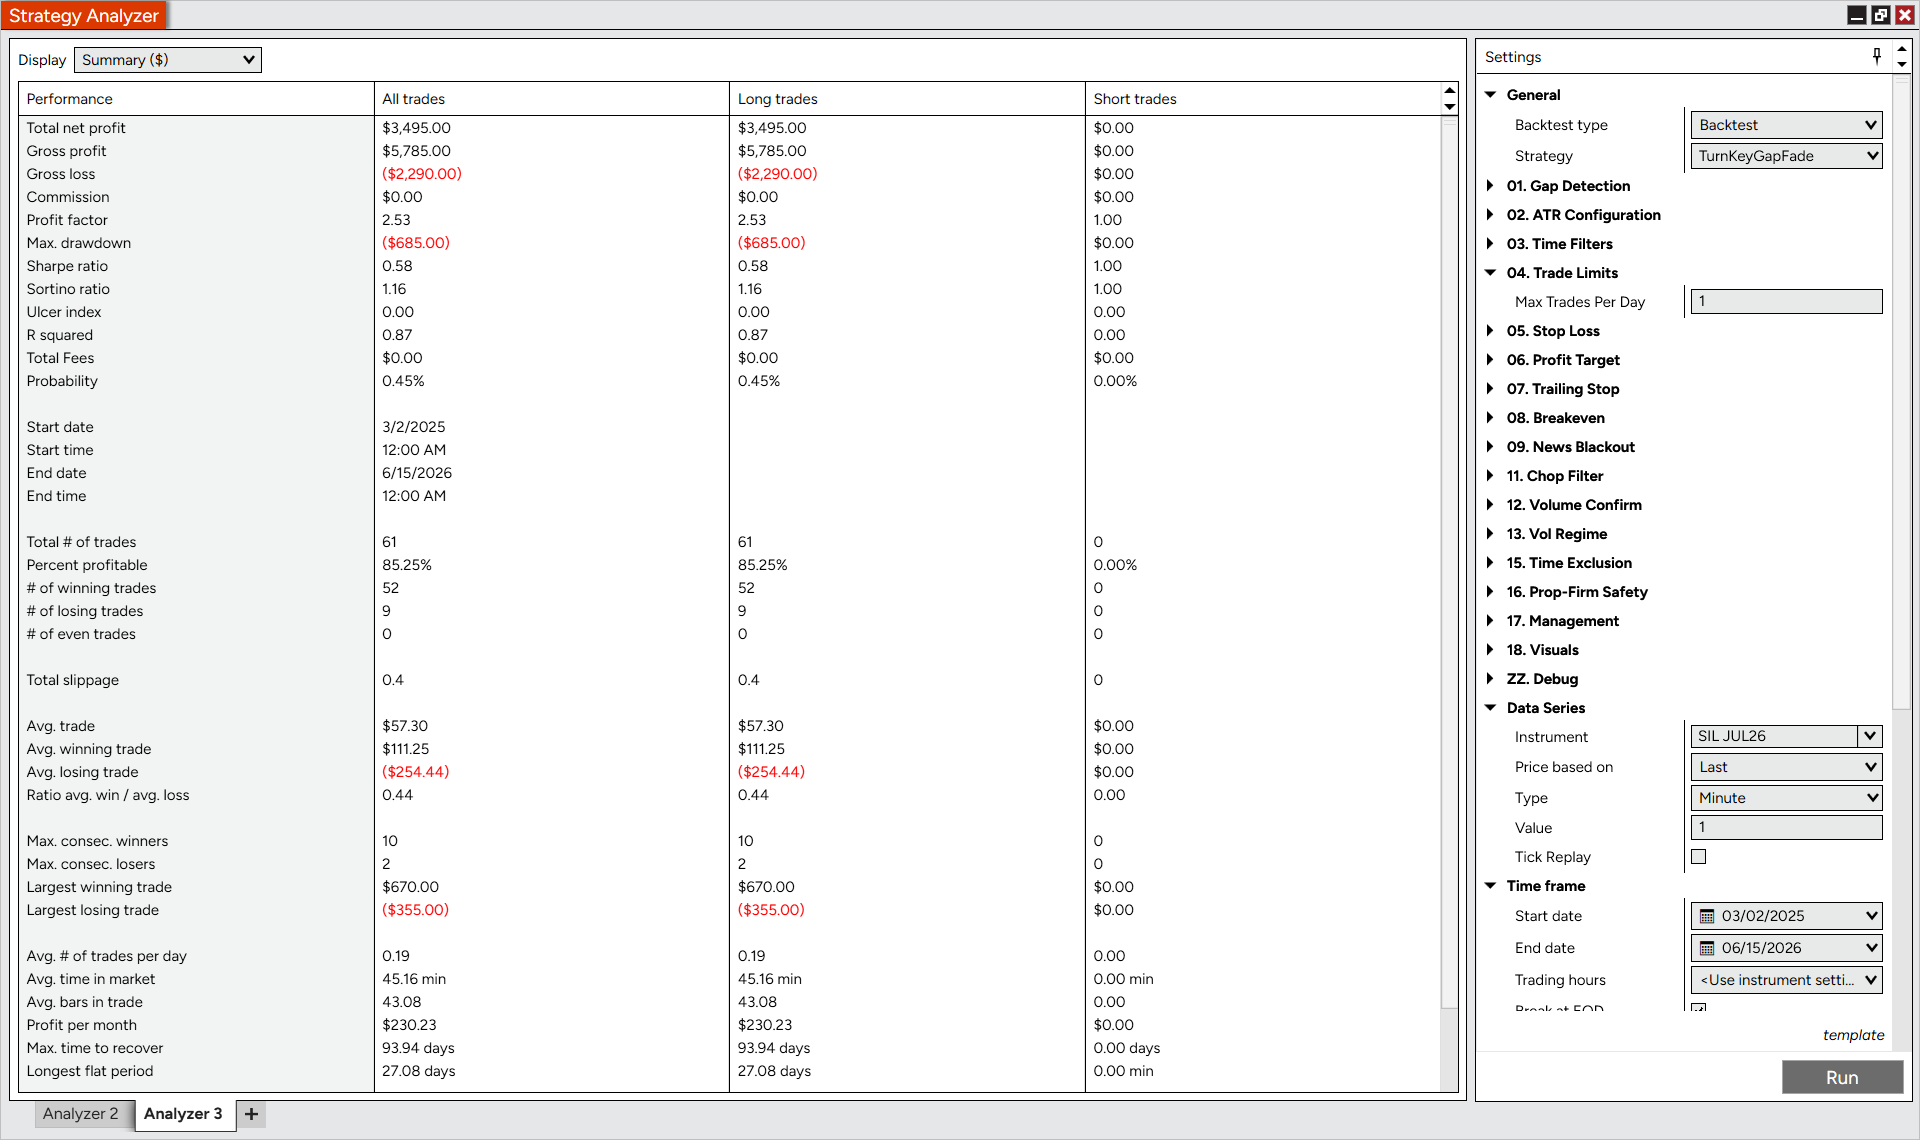
TurnKeyGapFade — SIL
1 micro contract · 1-minute
| Metric | Current tunelast 3 months | 15-monthstress test |
|---|
| Net P&L | $2,250 | $3,495 |
| Win rate | 93.3% | 85.3% |
| Profit factor | 7.82 | 2.53 |
| Max drawdown | $330 | $685 |
| Avg / month | $798 | $230 |
| Trades | 15 | 61 |
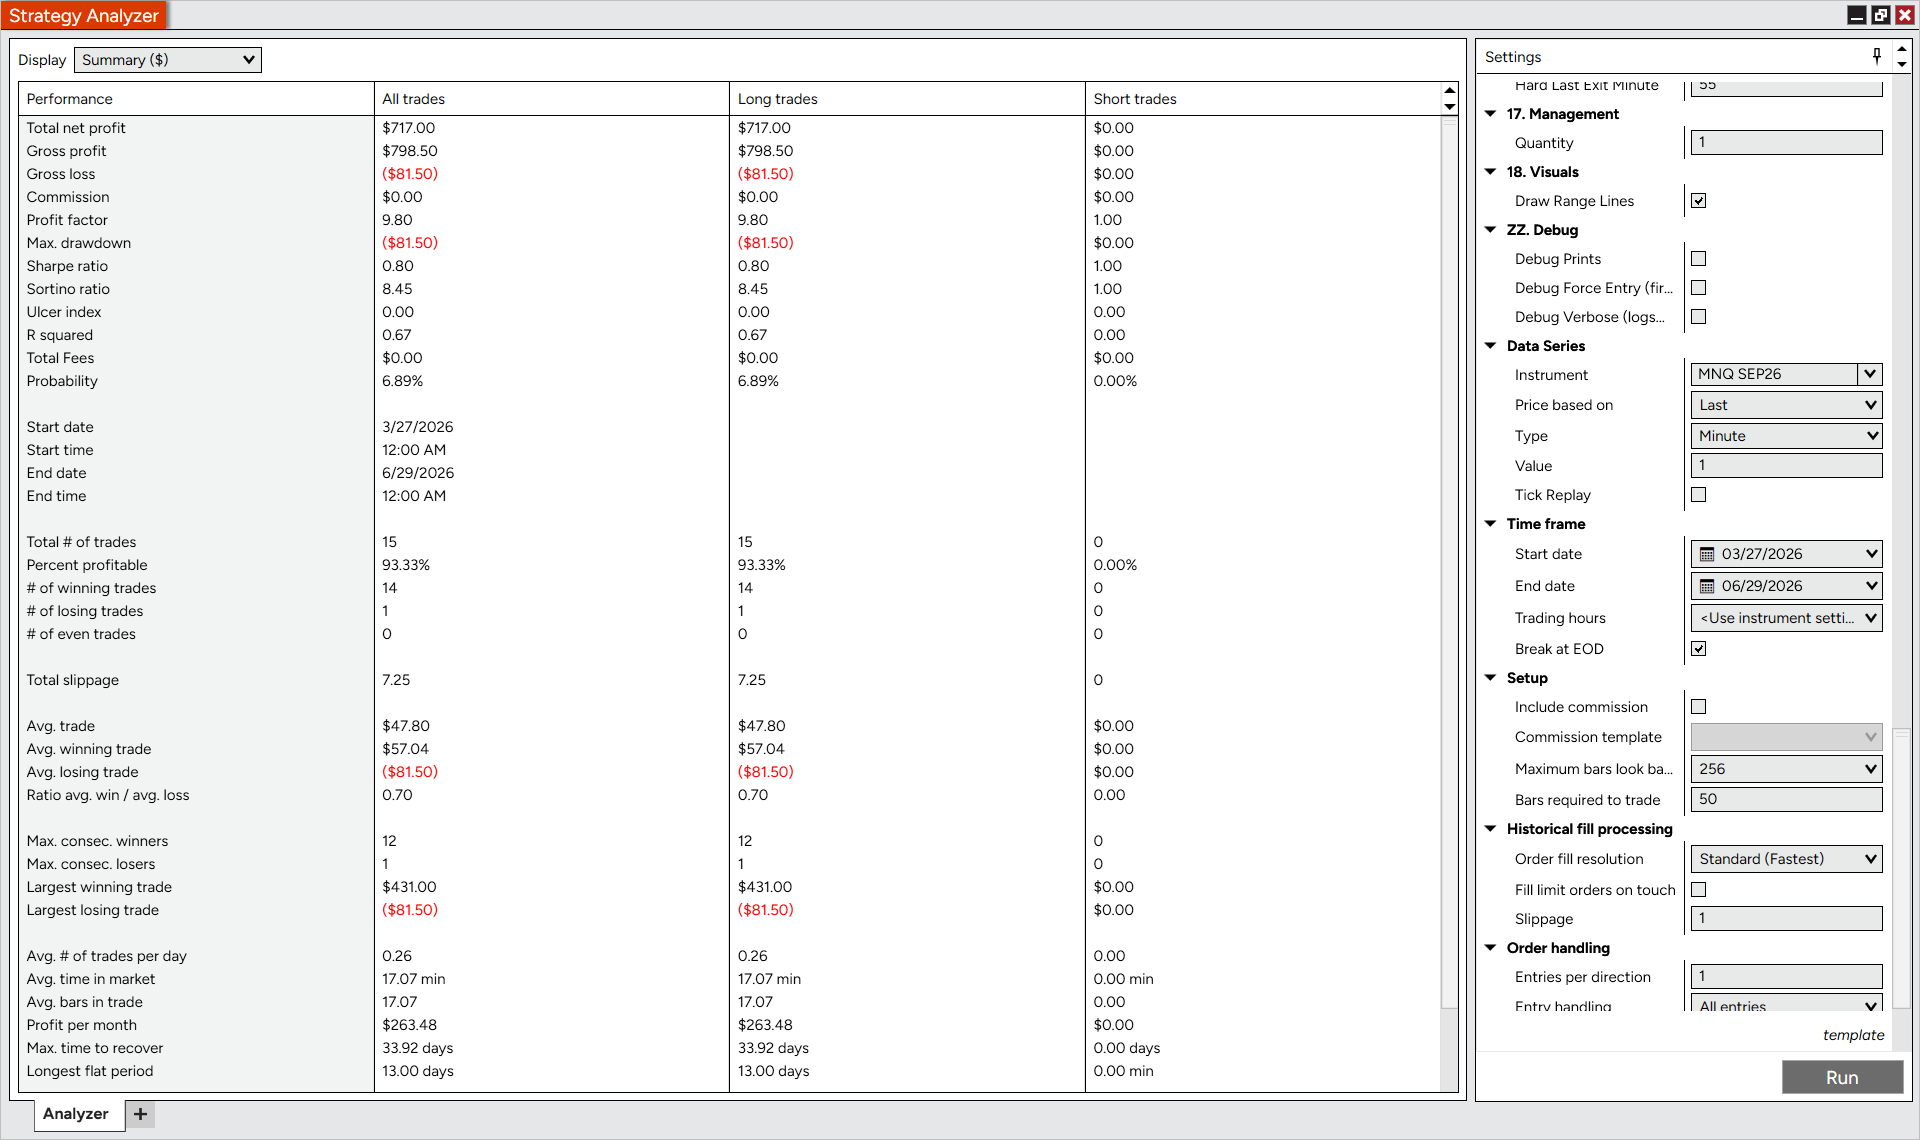
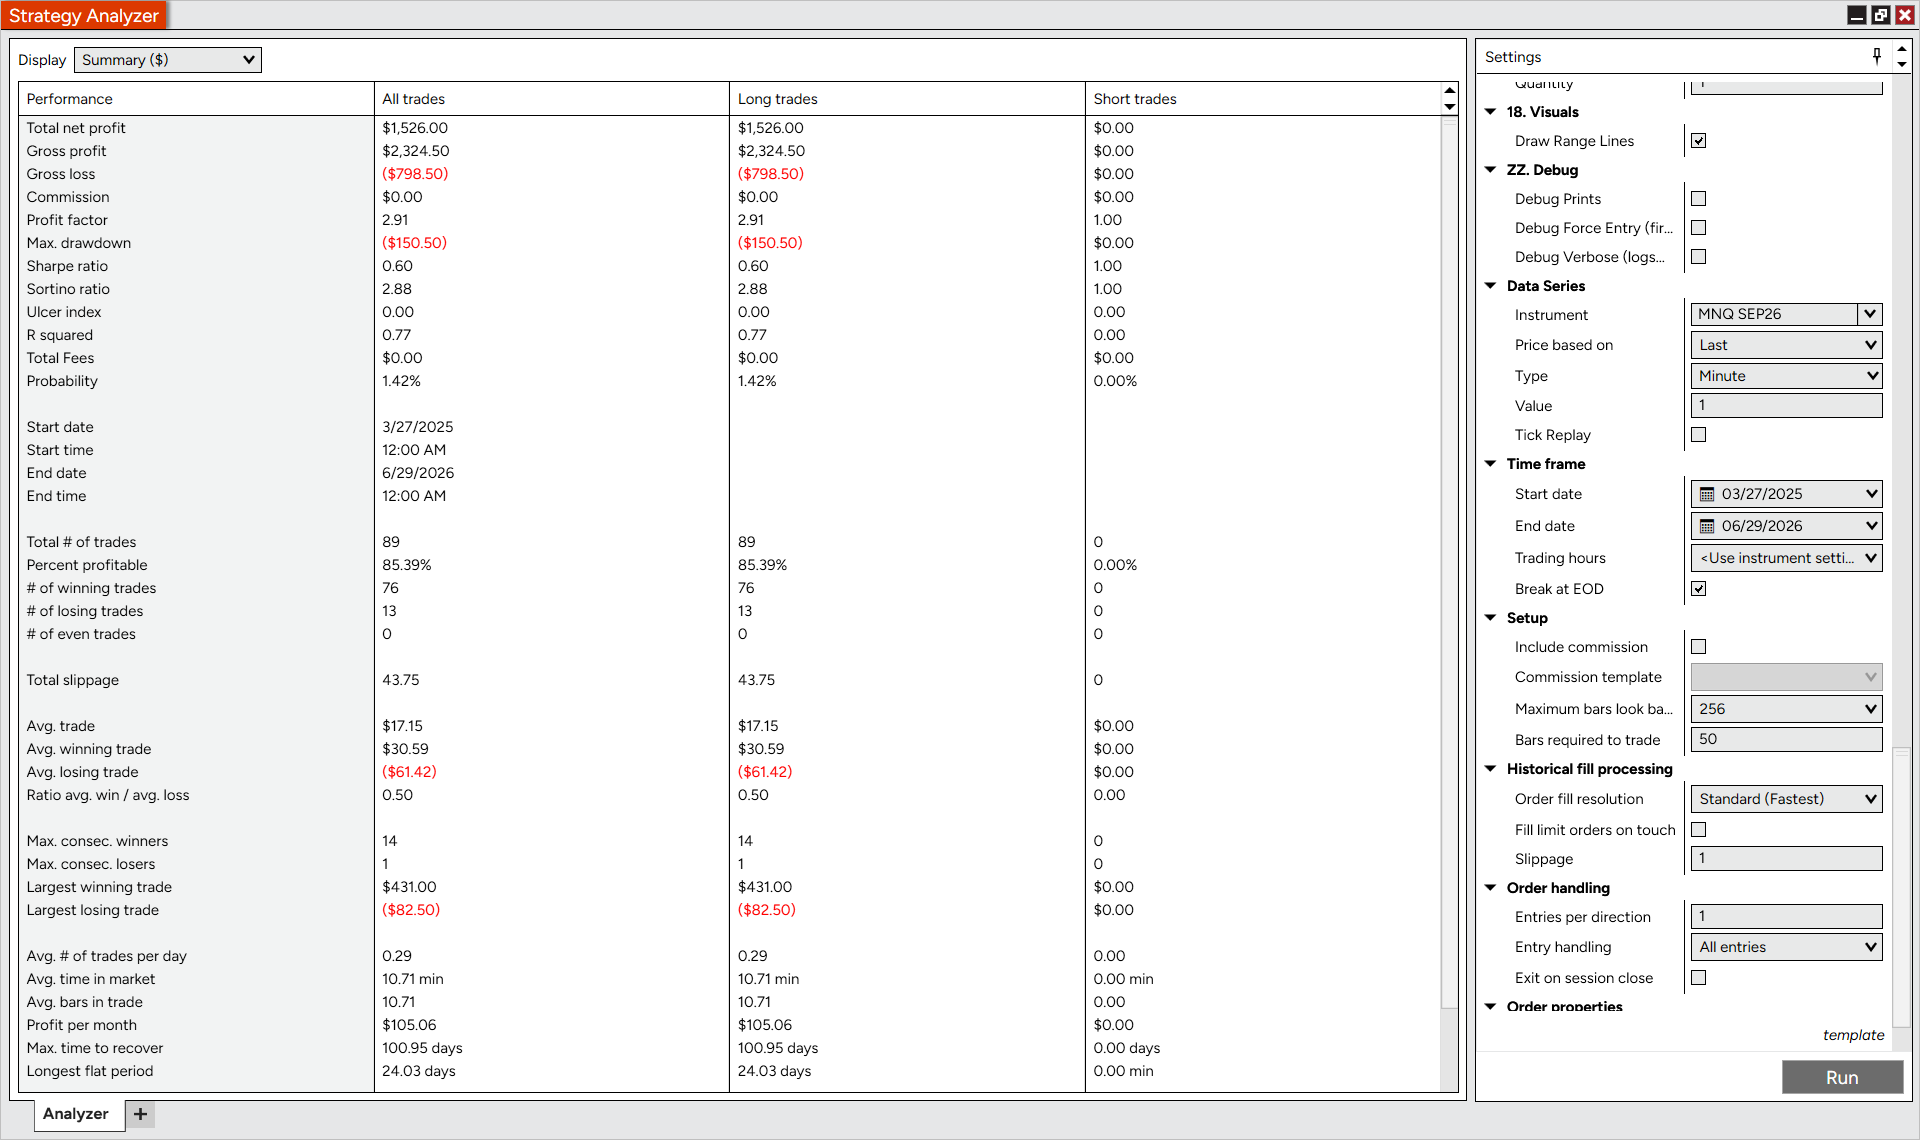
TurnKeyORBFade — MNQ
1 micro contract · 1-minute · long side
| Metric | Current tunelast 3 months | 15-monthstress test |
|---|
| Net P&L | $717 | $1,526 |
| Win rate | 93.3% | 85.4% |
| Profit factor | 9.80 | 2.91 |
| Max drawdown | $82 | $151 |
| Avg / month | $263 | $105 |
| Trades | 15 | 89 |
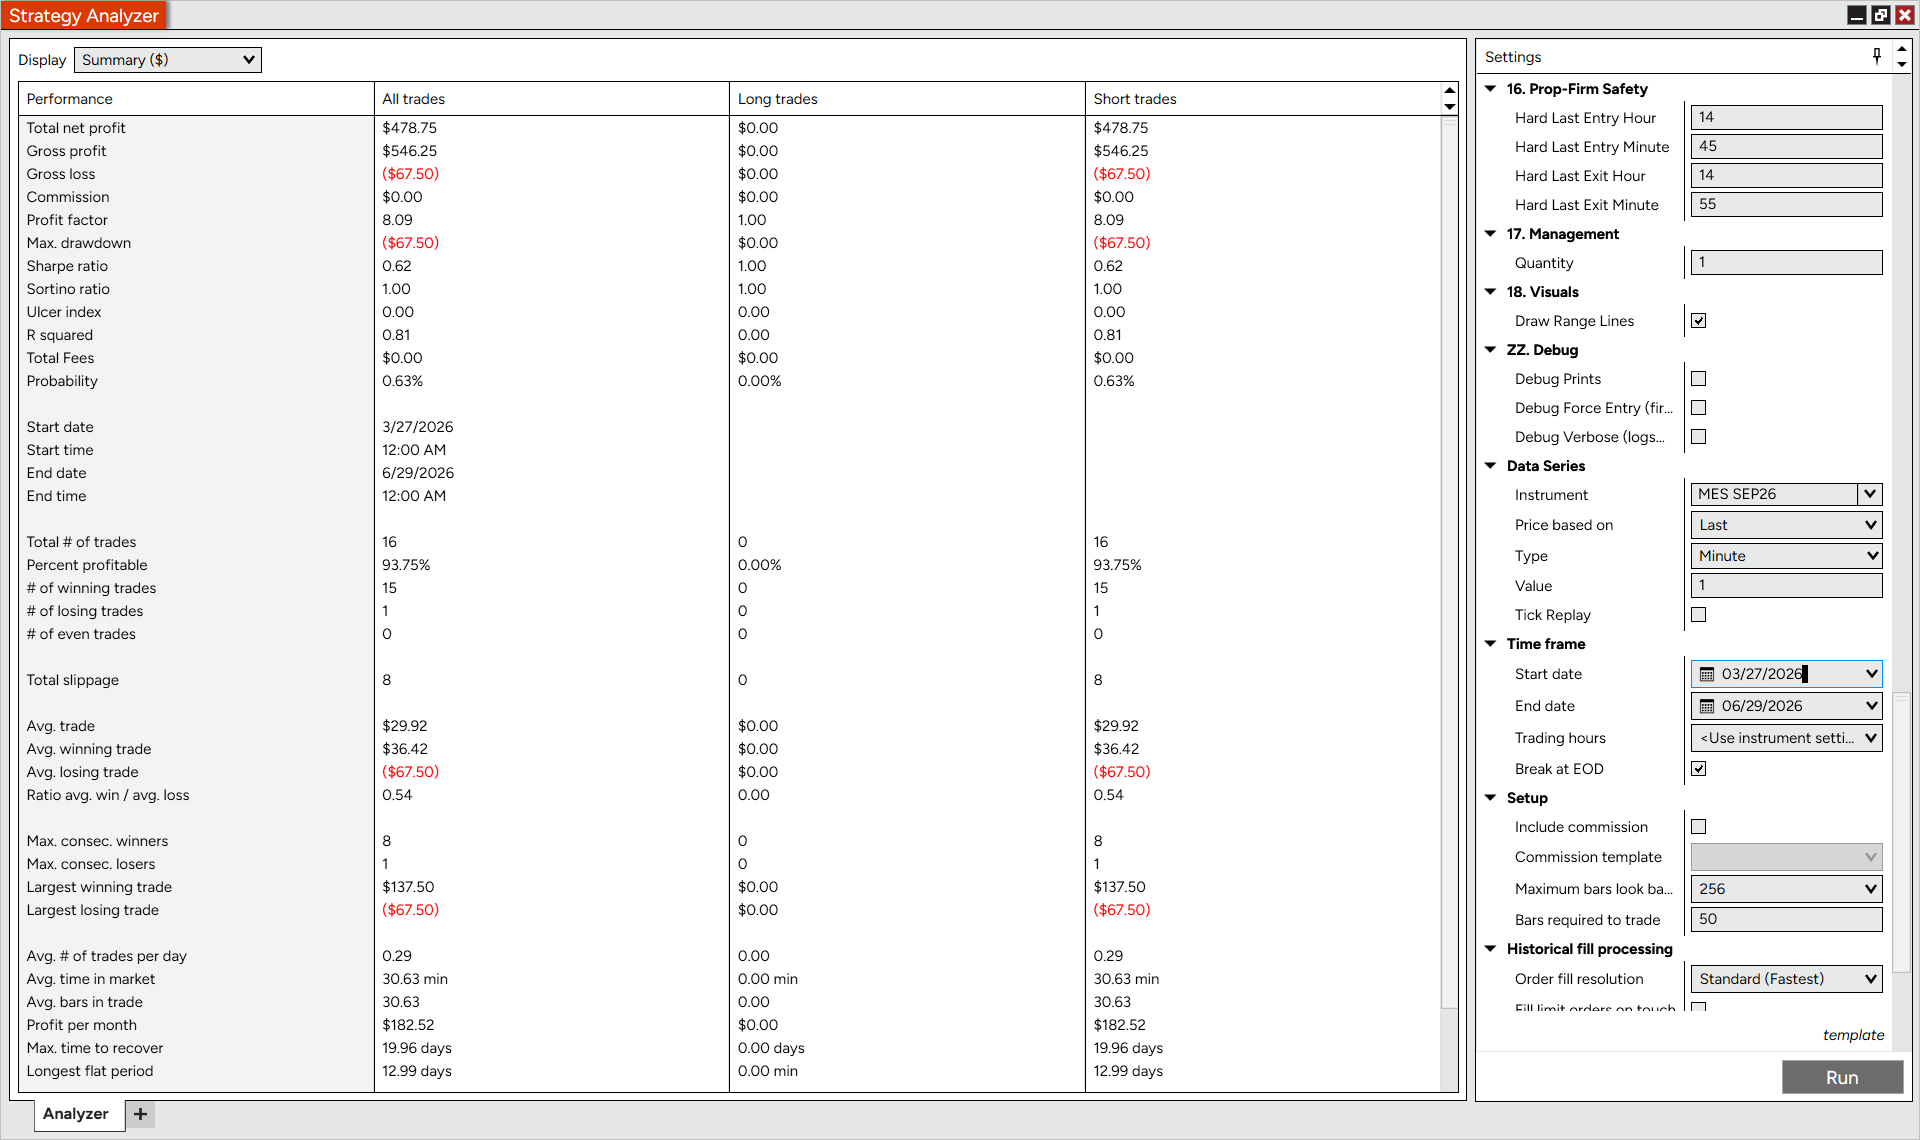
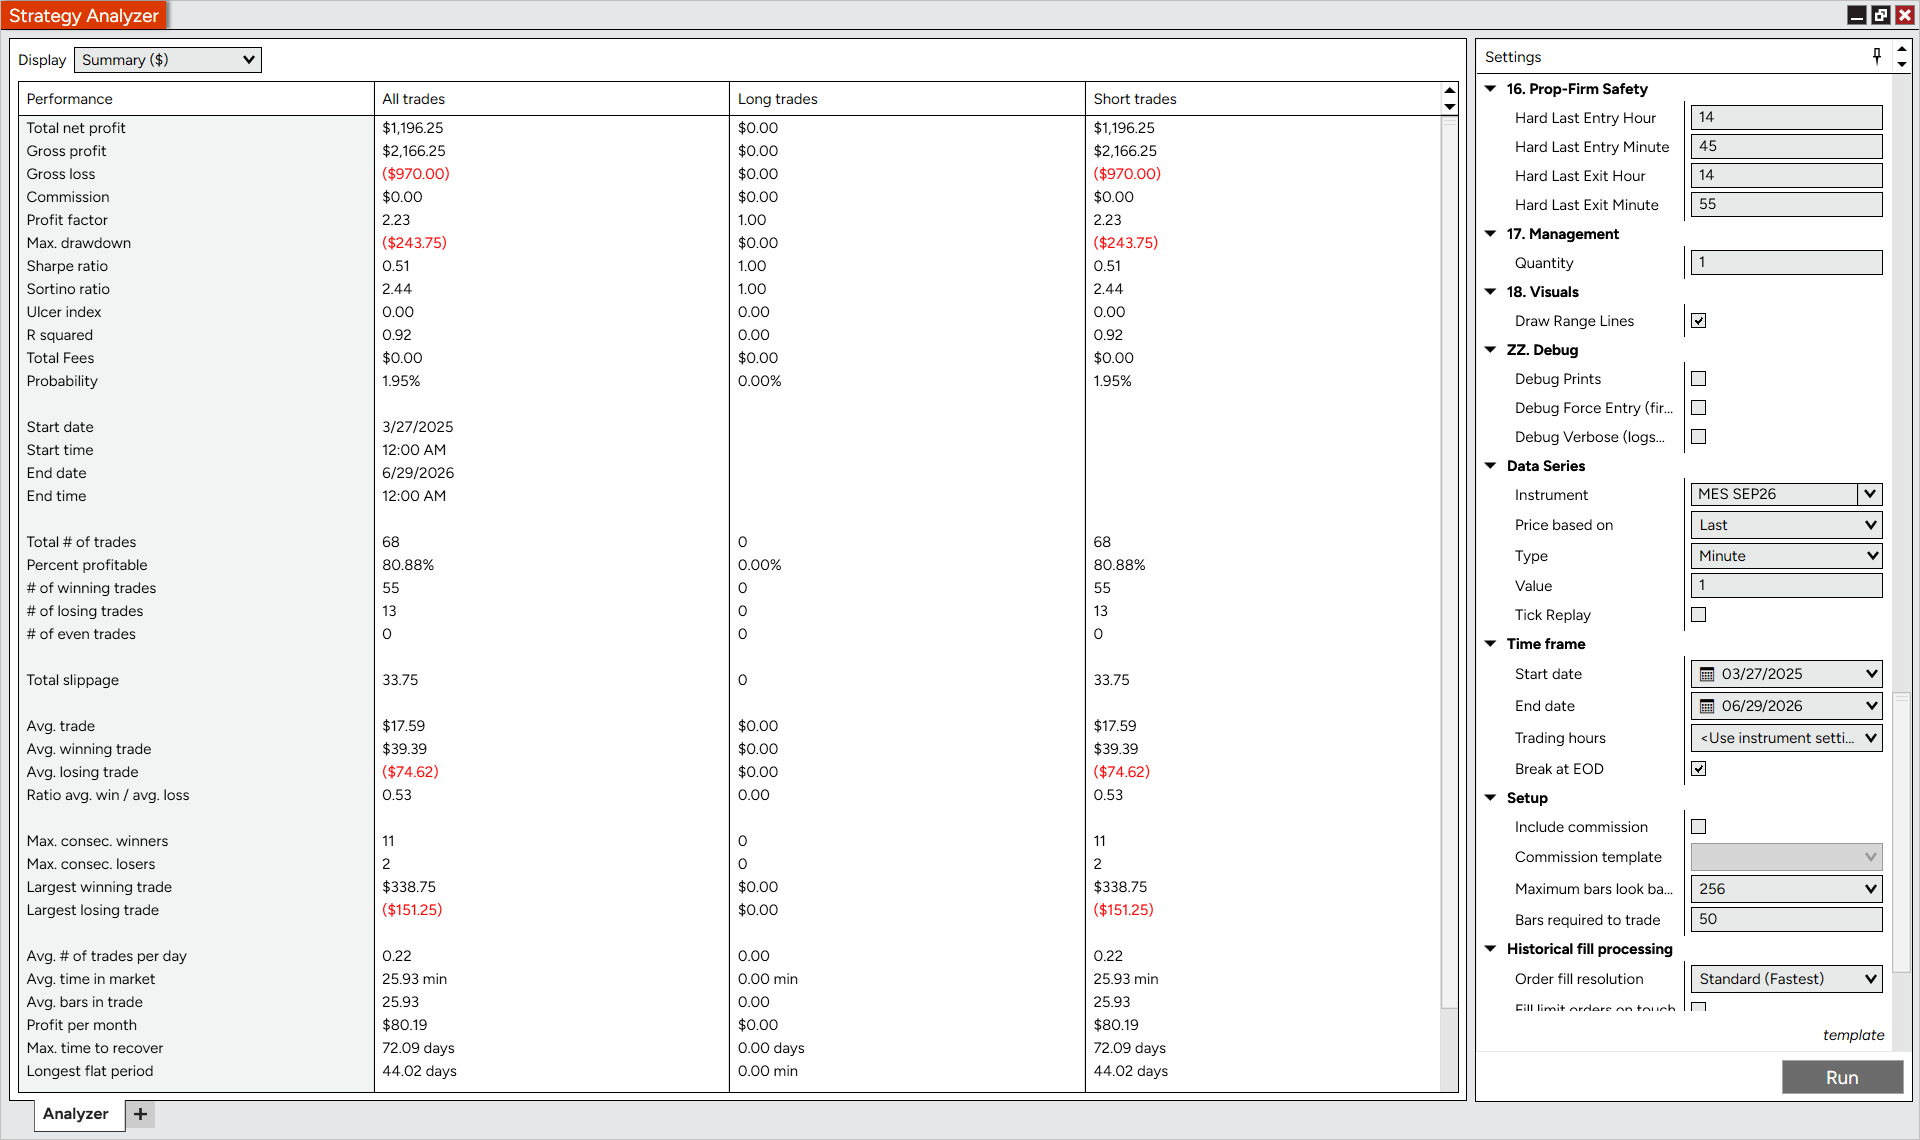
TurnKeyORBFade — MES
1 micro contract · 1-minute · short side
| Metric | Current tunelast 3 months | 15-monthstress test |
|---|
| Net P&L | $479 | $1,196 |
| Win rate | 93.8% | 80.9% |
| Profit factor | 8.09 | 2.23 |
| Max drawdown | $68 | $244 |
| Avg / month | $183 | $80 |
| Trades | 16 | 68 |
More instruments are being added — same format, 1 micro contract.
Order Flow
Order Flow Strategies
Order-flow strategies can only be backtested about 3 months back — that's as far as reliable volumetric / order-flow data
exists, so there's no honest way to show a longer window. What you see below is the full available sample, not a trimmed one.
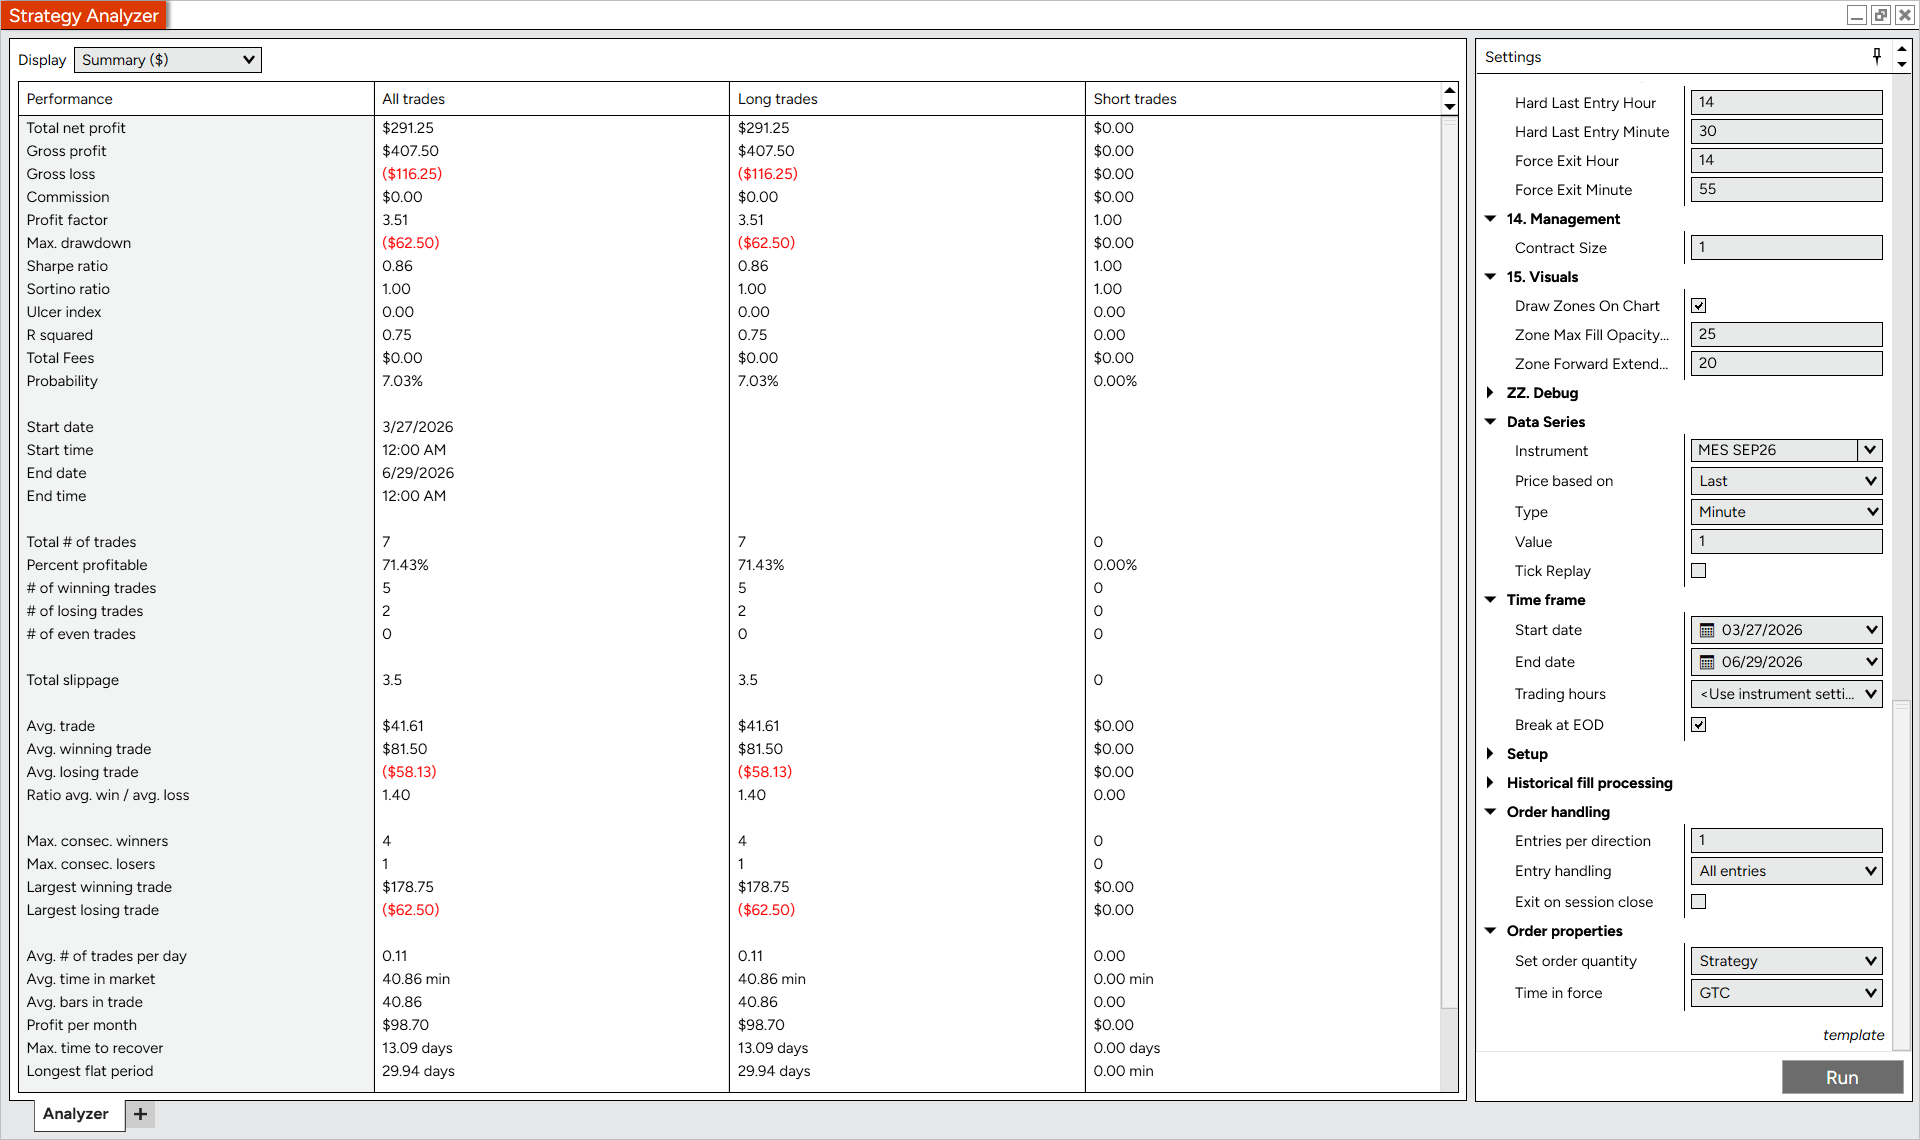
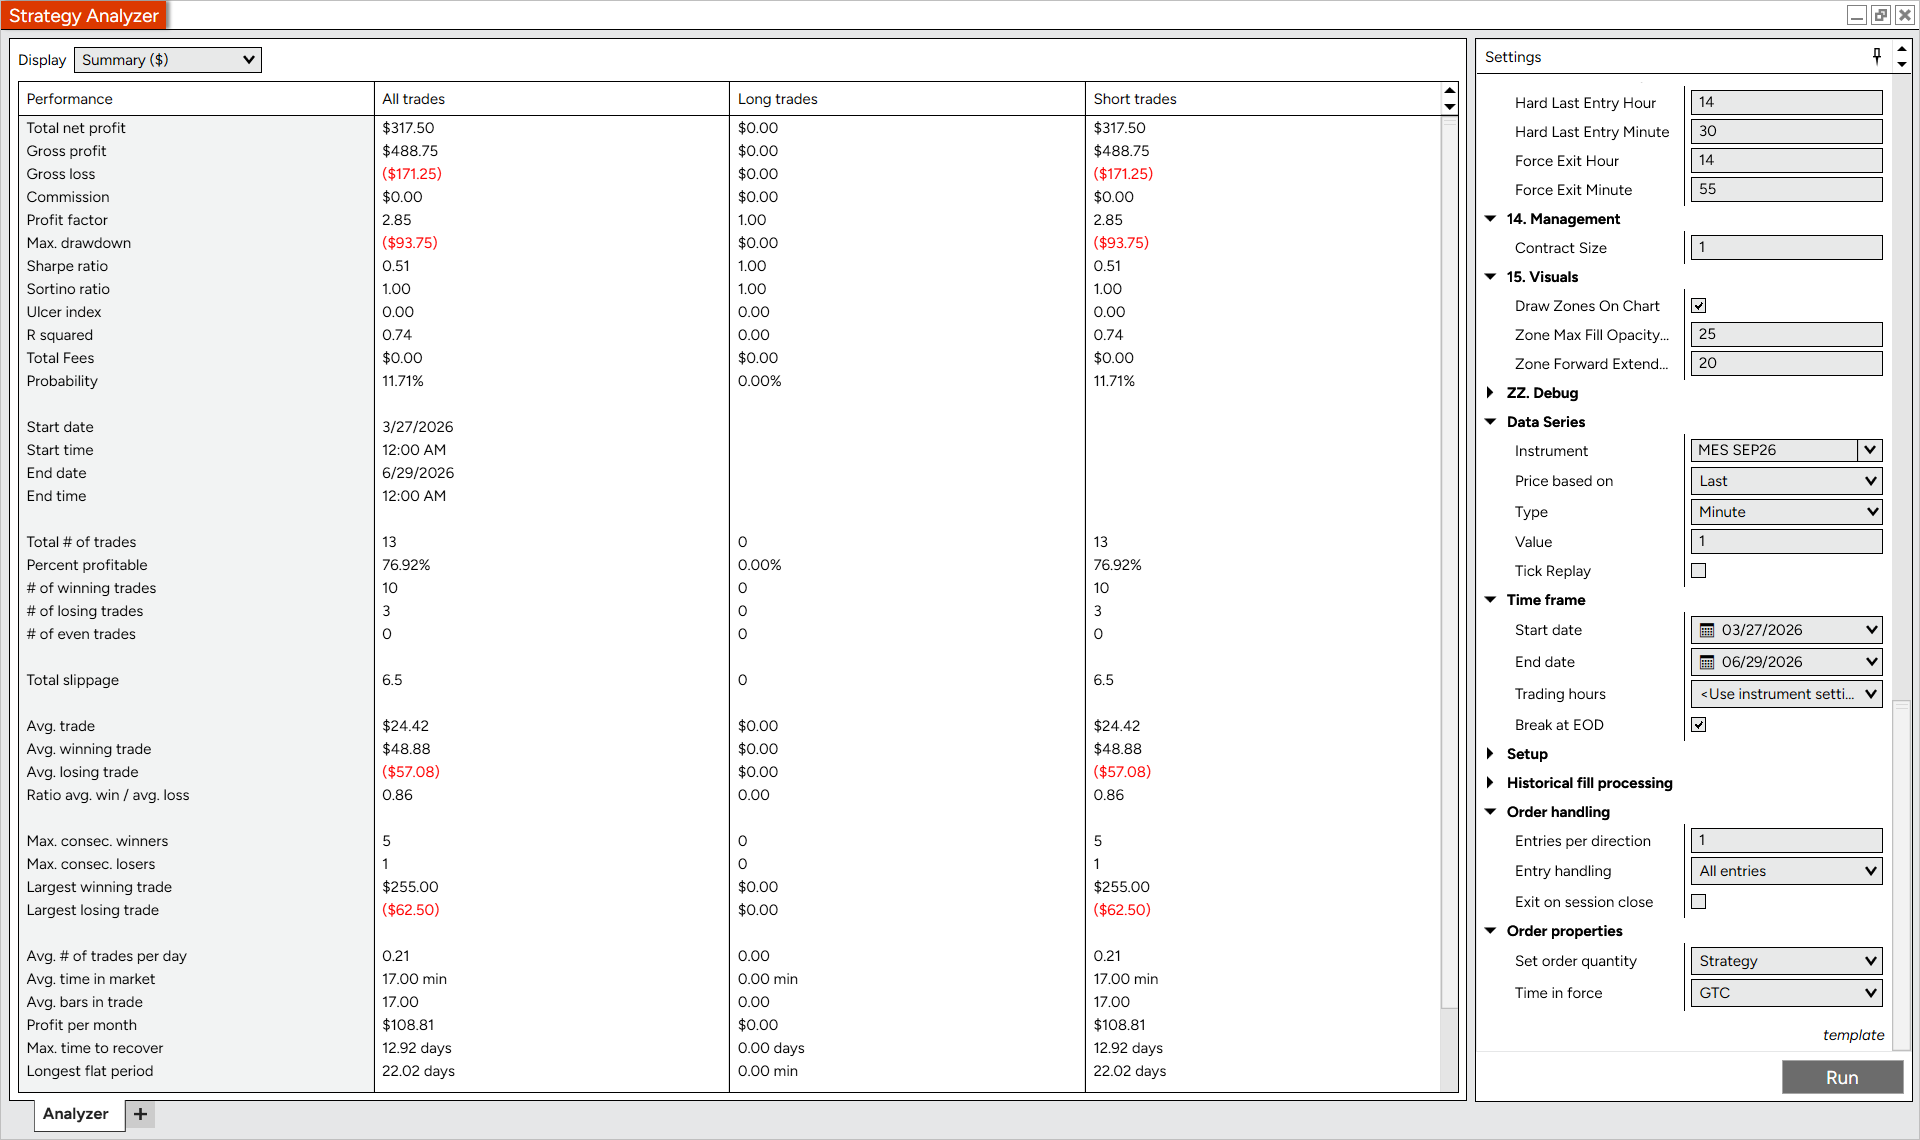
TurnKeyImbalanceDefender — MES
1 micro contract · 1-minute · order flow · 3-month sample
| Metric | Long side3-month | Short side3-month |
|---|
| Net P&L | $291 | $318 |
| Win rate | 71.4% | 76.9% |
| Profit factor | 3.51 | 2.85 |
| Max drawdown | $63 | $94 |
| Avg / month | $99 | $109 |
| Trades | 7 | 13 |
Why only 3 months: order-flow / volumetric data isn't reliably available further back, so this strategy can't be tested over a longer window. Long and short are shown as separate runs (7 and 13 trades) — a deliberately small, honest sample.
Lifetime
Lifetime
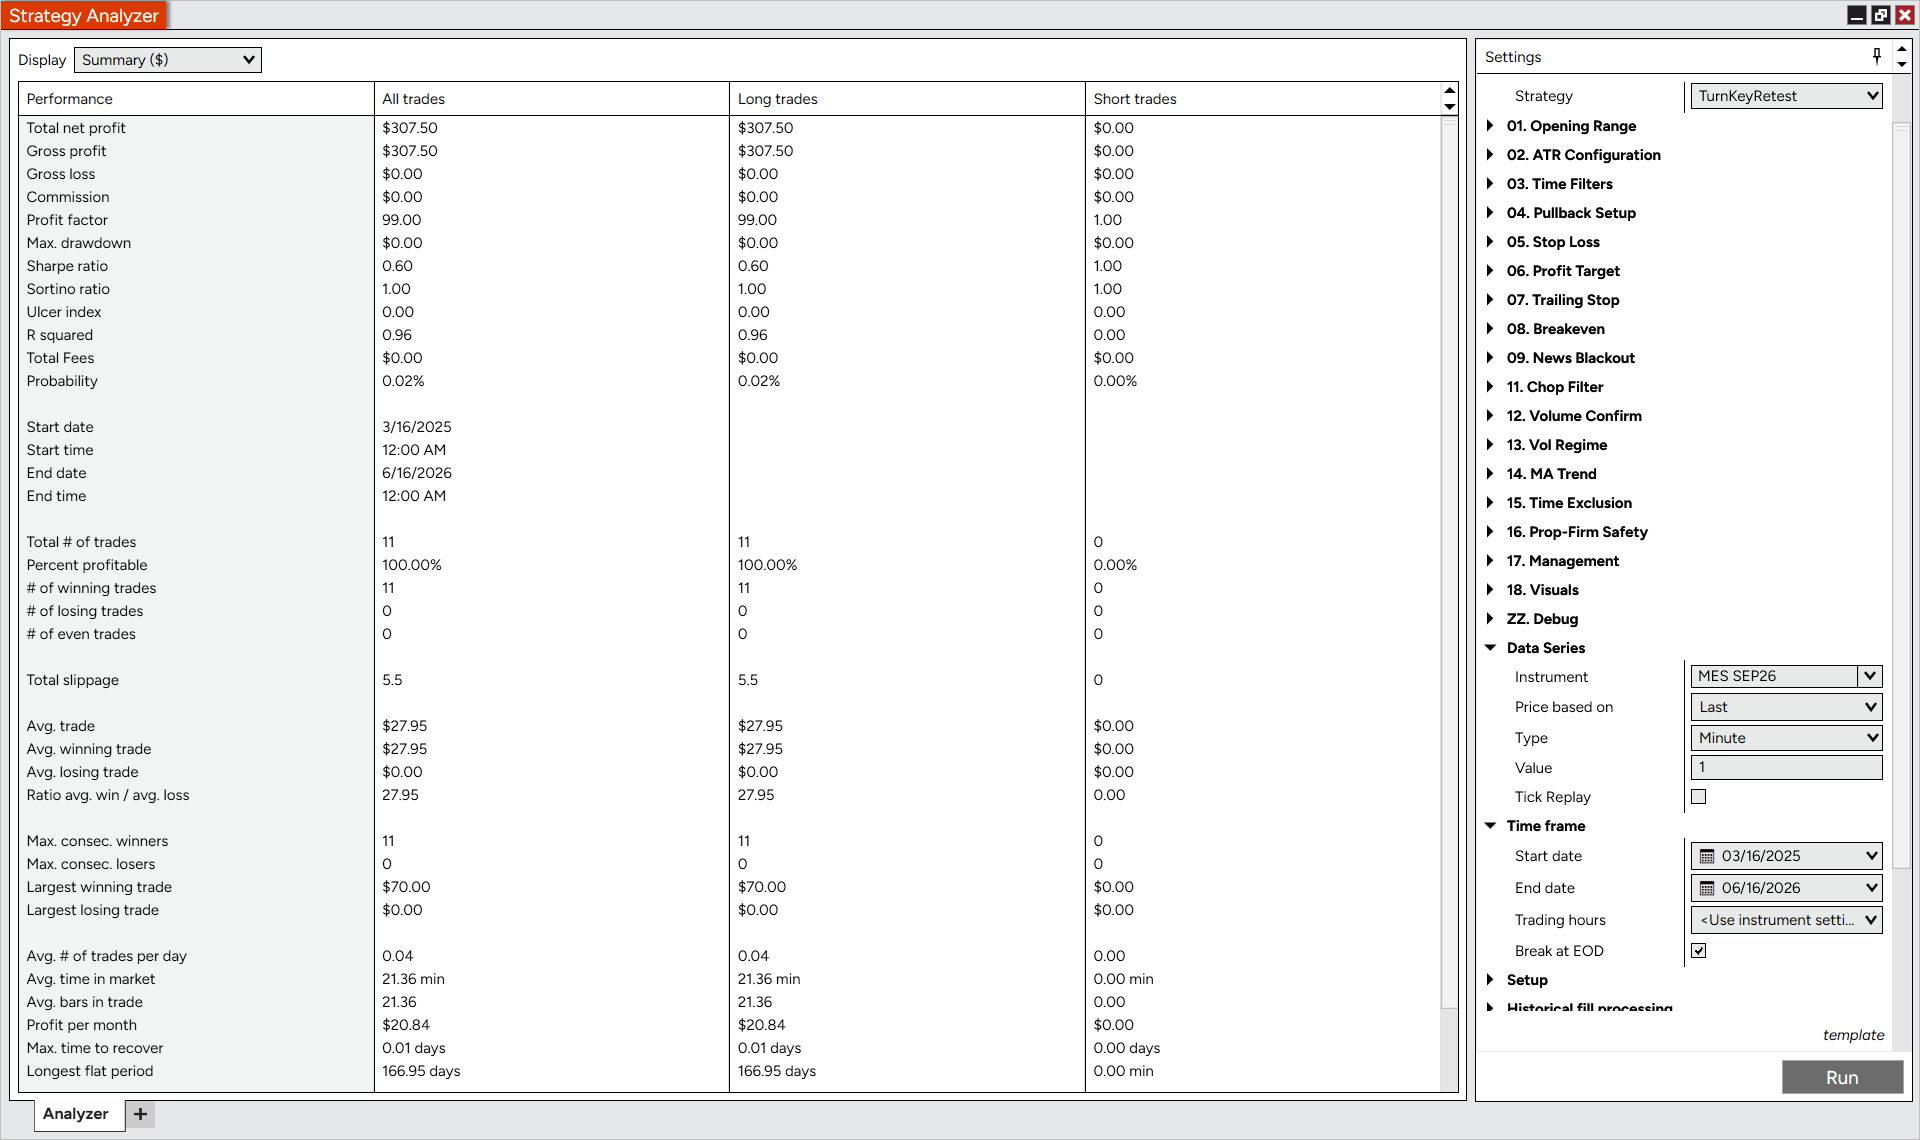
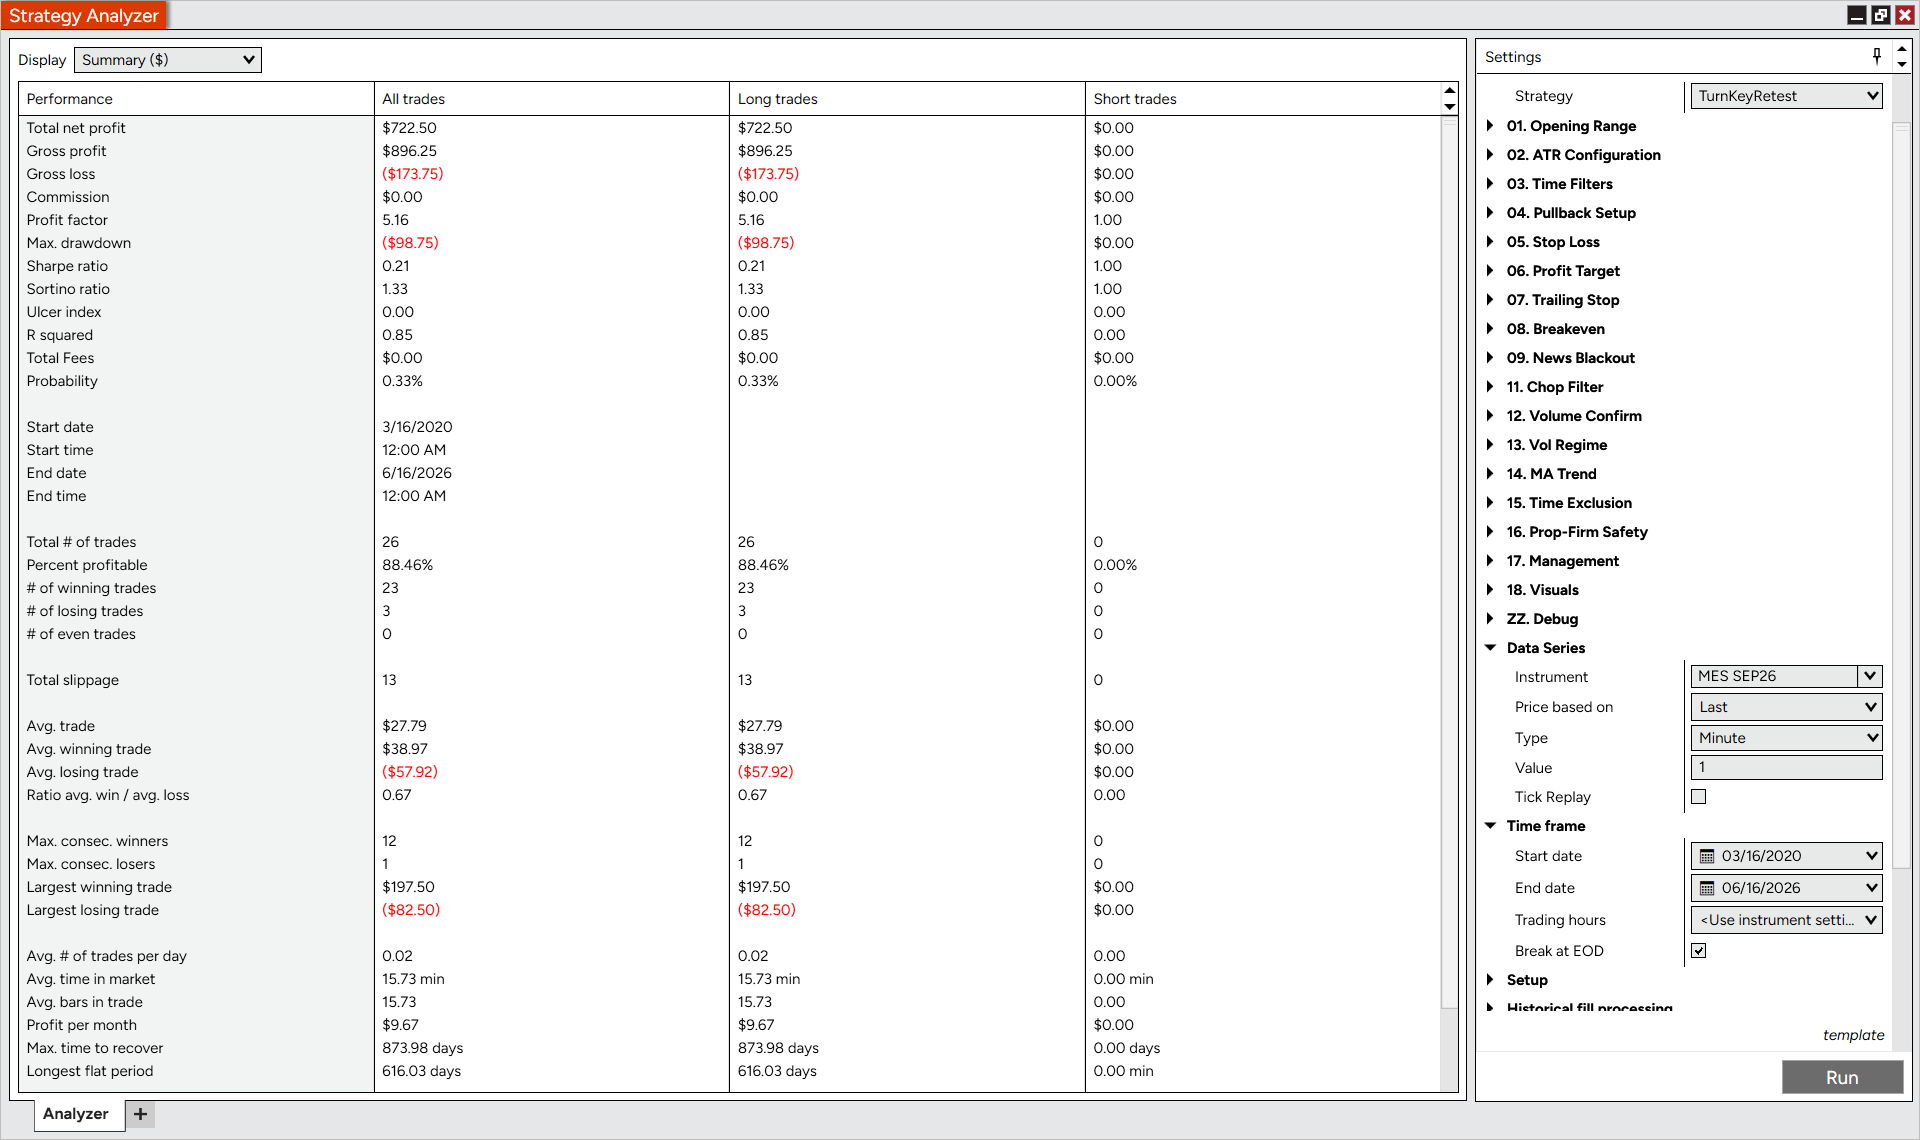
TurnKeyRetest is rare by design — it only fires on a specific re-test setup, so the trade count is low and there can be long flat
stretches between signals. That's the trade-off for its high hit rate. Shown over the last 15 months and its full 6-year history.
TurnKeyRetest — MES
1 micro contract · 1-minute · long side
| Metric | 15-monthrecent | 6-yearfull history |
|---|
| Net P&L | $308 | $723 |
| Win rate | 100% | 88.5% |
| Profit factor | no losses* | 5.16 |
| Max drawdown | $0 | $99 |
| Avg / month | $21 | $10 |
| Trades | 11 | 26 |
* Rare by design: 11 trades with no losers in the 15-month window — a small sample, which is why that column looks flawless. The 6-year column (26 trades, 88.5% win, longest flat stretch ~616 days) is the honest read on how infrequent — and how strong — these setups are.
Hypothetical Performance Disclosure
The results shown on this page are based on backtested historical data and do not represent actual trading. Hypothetical or
simulated performance results have inherent limitations — unlike an actual performance record, simulated results do not
represent actual trading and may not reflect the impact of market factors such as liquidity. No representation is being made
that any account will achieve profits or losses similar to those shown. Past performance is not indicative of future results.
Trading futures involves substantial risk of loss and s not suitable for all investors.